Solana (SOL/USD) Trade Waxes Higher, Breaking Resistances
Estimated Reading Time: 3 minutes
Don’t invest unless you’re prepared to lose all the money you invest. This is a high-risk investment and you are unlikely to be protected if something goes wrong. Take 2 minutes to learn more
Solana Price Prediction – December 8
Buulls have been exerting muscles in the market of Solana against the US Dollar as the crypto-economic trade waxes higher presently, breaking resistances toward the point of $80.
The price swiftly found support near the $60 line during the most recent correctional action before continuing its northward trajectory that has brought it to $71.82, maintaining a 5.96 percentage positive rate of return. Buyers will probably add additional weights in the ensuing transactional events, which could lead to consolidation in a slow-and-steady systemic motion style. Appreciation of positions is anticipated for the majority of investors who purchased at the lower end of the Bollinger Band indications.
SOL/USD Market
Key Levels:.
Resistance levels:$80, $90, $100
Support levels: $60, $50, $40
SOL/USD – Daily Chart
The SOL/USD daily chart reveals the crypto market waxes higher, breaking resistances by stretching the upper part of the Bollinger Bands.
The Bollinger Band trend lines are in the shape of pointing toward the north, basing their lower footstep closely above the pivotal point of $50. Their upper part has been consistently pushed in a thin direction toward the resistance line of $80.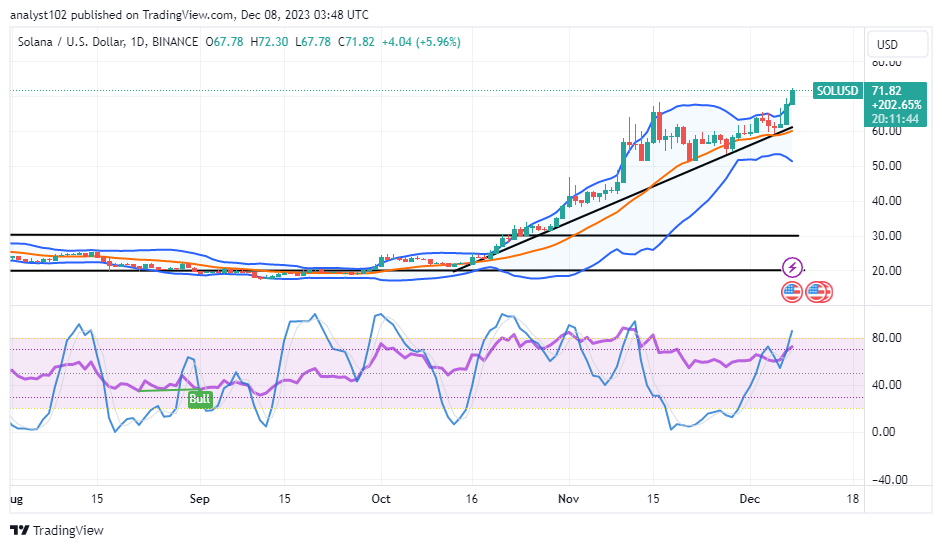
Is it technically optimal to take advantage of the forces of upheaval that are currently operating in the SOL/USD market?
As there has been a steady rising motion in the SOL/USD business activities up to the point of stretching northwardly alongside the upper Bollinger Band, buyers need to be extraordinarily cautious of executing fresh positions as the price waxes higher, breaking resistances.
As for now, long-term position placers must wait for a large selling candlestick formation around the upper line of the Bollinger Band to watch any likely trade event that can cause depression against long-term smooth mooning pushes before placing a short line of sales.
Additionally, as the stochastic oscillators have shown that the market’s velocity is gradually approaching the overbought area, investors may soon employ strategies for partial withdrawal of some points. Nevertheless, the line of positivity is still greater when taking into account the trend of the market’s price action, indicating that fresh selling orders typically lose money when conducting instant shorting.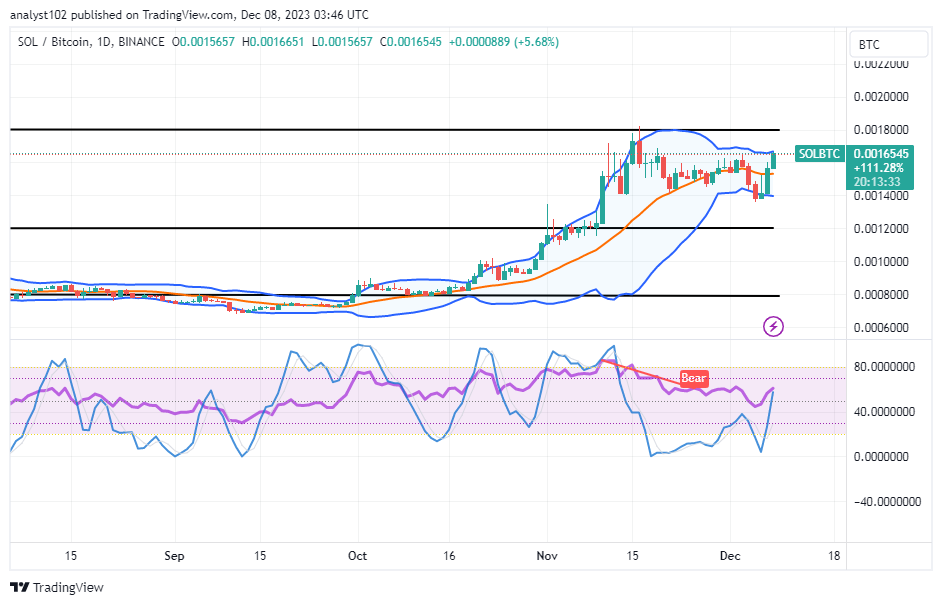
SOL/BTC Price Analysis
In contrast, the Solana market waxes higher trading against Bitcoin, breaking resistances around the upper Bollinger Band.
There is an upward swerve in the stochastic oscillators. Additionally, their placement just beyond the 40th line suggests that a rise is likely on the horizon. The bullish flag shape of the Bollinger Band trend lines is largely being maintained. A series of pulldowns is probably going to happen on purpose to add more and more impetus to the northward movements. Investors should remain optimistic, as stronger positive forces are anticipated to manifest in the upcoming months.
Note: Cryptosignals.org is not a financial advisor. Do your research before investing your funds in any financial asset or presented product or event. We are not responsible for your investing results.
You can purchase Lucky Block here. Buy LBLOCK