Bitcoin (BTC/USD) Price Is Lowering, Conjecturing a Base
Estimated Reading Time: 3 minutes
Don’t invest unless you’re prepared to lose all the money you invest. This is a high-risk investment and you are unlikely to be protected if something goes wrong. Take 2 minutes to learn more
Bitcoin Price Prediction – April 17
It has been significantly demonstrated that the process that could let bulls regain their stances in the BTC/USD trade against bears has not been gaining a healthy weight, given that the crypto business is presently lowering and conjecturing a base reconstruction move around the point of $60,000.
If the correction movements that have taken center stage in the exchange lines continue, it would be a shocking move that would eventually see the price of the cryptocurrency drop much lower, to a support level of $50,000. However, given that the cycle of rebounding has been garnering a lot of attention this month, that scenario might not offer a highly technical arrangement setup to achieve excellent shorting entry.
BTC/USD Market
Key Levels:
Resistance levels: $70,000, $75,000, $80,000
Support levels: $55,000, $52,500, $50,000
BTC/USD – Daily Chart
The BTC/USD daily chart reveals that the crypto market is lowering, conjecturing a low around the point of $60,000.
The Bollinger Band trend lines are positioned at higher trade zones, with their lower part being relatively stretched by the reactions of sellers. Variant low-falling forces have been made on the feature of candlesticks to denote that some falls are in place. The stochastic oscillators are in the oversold region, denoting that a consolidation movement is tentatively going on.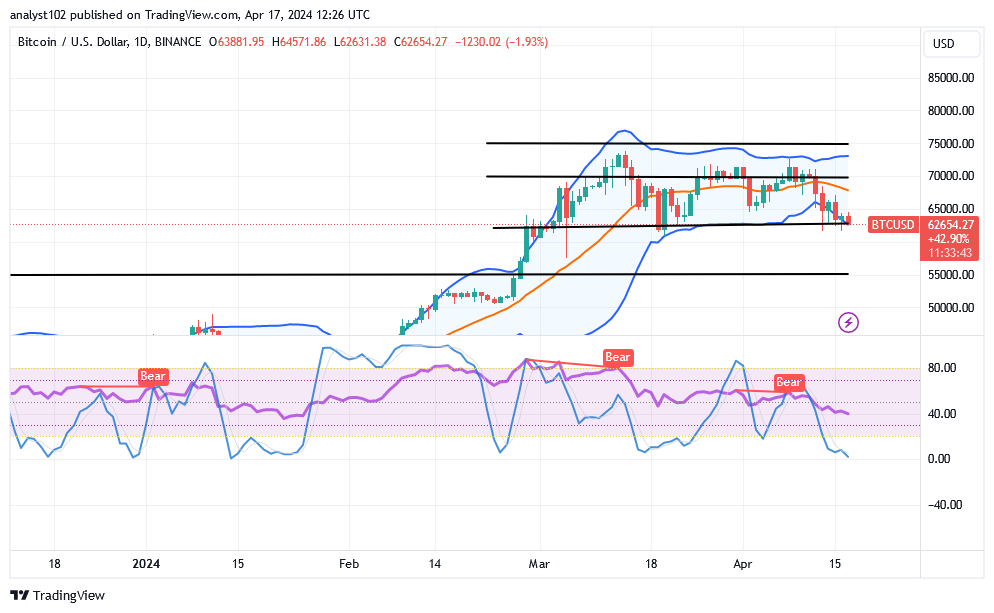
As there has been a correction in the price of Bitcoin over USD, should sellers freely execute shorting orders at $60,000?
It might not be too safe for sellers to continue to execute selling position orders below the point of $60,000, as the BTC/USD market is lowering, conjecturing a base even around the point mentioned.
Upon noticing a tiny upward spike signal, long-position movers with substantial equity may start to introduce a portion of their money to the smallest lot size. In order to run long-term, they will need to abandon their position and pay attention to the stochastic oscillators heading upward.
In the event that short-position movers in the Bitcoin/USD market manage to regain decent entry, the middle Bollinger Band trend line will be a more useful tool, particularly around the $70,000 resistance level. To provide a clear indication of a shorting order, there must be some pulls toward or toward the value line, together with rejection signals at the top end of the candlestick’s development.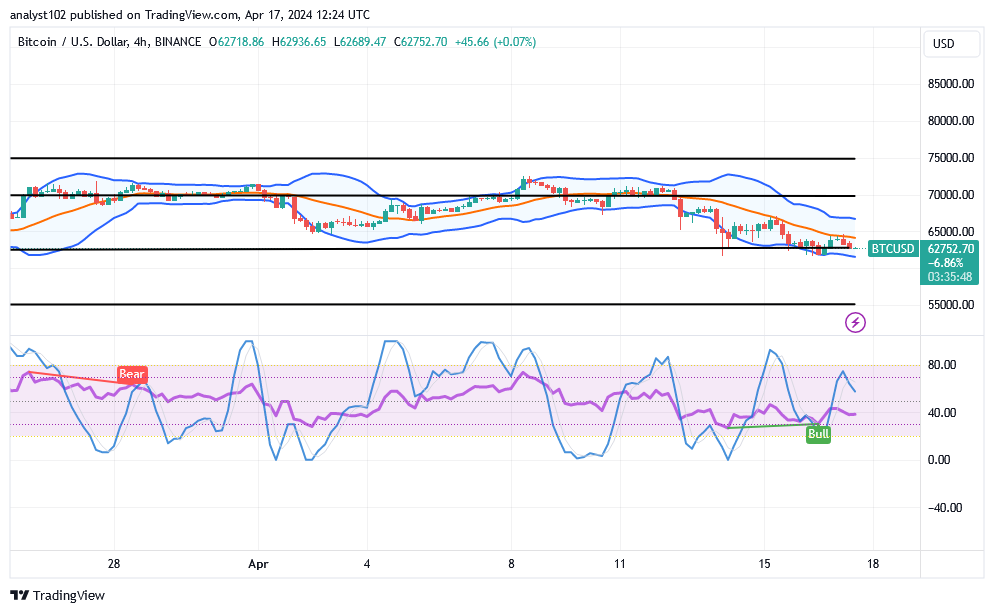
BTC/USD 4-hour Chart
The BTC/USD 4-hour chart shows that the crypto market is lowering and conjecturing a base reformation around $60,000.
The Bollinger Band trend lines have managed to briefly bend southbound to connote that boundaries of getting back rebounds are being formed. In order to acquire a curved shape on the south side beyond the line of 80, the stochastic oscillators have veered upward. Psychologically, it would be acceptable to wait for index bounces before placing a buy order.
Note: Cryptosignals.org is not a financial advisor. Do your research before investing your funds in any financial asset or presented product or event. We are not responsible for your investing results.
You can purchase Lucky Block here. Buy LBLOCK