Bitcoin (BTC/USD) Trade Decreases, Tending to Find Support
Estimated Reading Time: 3 minutes
Don’t invest unless you’re prepared to lose all the money you invest. This is a high-risk investment and you are unlikely to be protected if something goes wrong. Take 2 minutes to learn more
Bitcoin Price Prediction – April 14
It has been closely observed that the point of $60,000 will serve as the key line against seeing more falls, given that the BTC/USD market is currently decreasing and tending to find support around the value line mentioned.
As things may turn out in the near future, today’s candlestick formation has shown that bulls are well-positioned to reclaim their gains, so long as the $60,000 support level doesn’t collapse in a way that prevents long-term declines. On the basis of such a supposition, purchasing orders might be implemented gradually and in a long-term way.
BTC/USD Market
Key Levels:
Resistance levels: $70,000, $75,000, $80,000
Support levels: $60,000, $57,500, $55,000
BTC/USD – Daily Chart
The BTC/USD daily chart showcases the crypto market decreasing, tending to find support around the value line of $60,000.
The stochastic oscillators have had the blue line touch through some points in the oversold region, denoting that a considerable maximal southward movement has been reached. The lower Bollinger Band trend line, together with a horizontal line below it, are going to provide spots where buyers are likely to get a decent rebounding entry signal.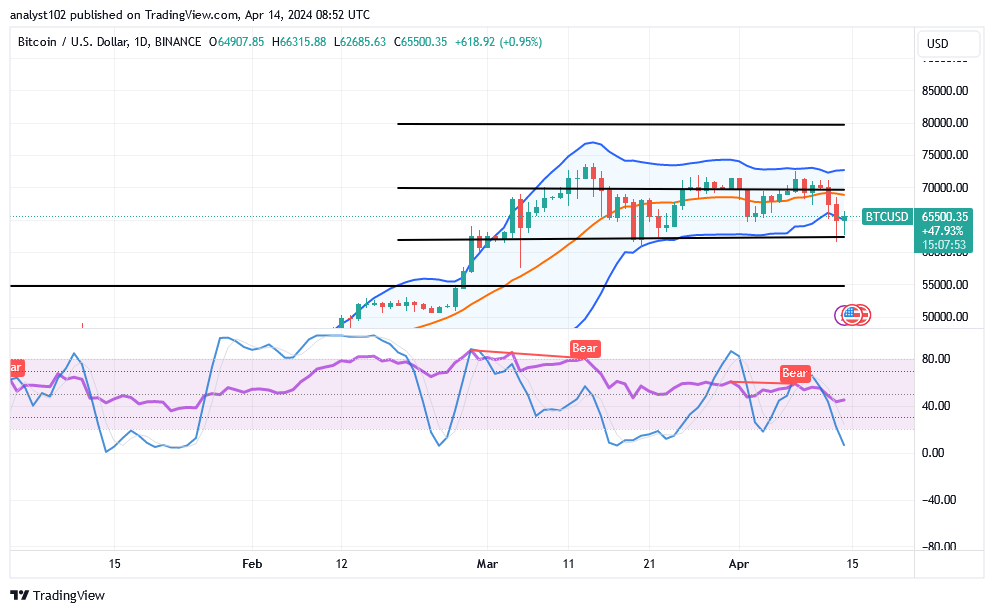
Where is the present position of the positive crypto signal in the BTXC/USD market operations?
A horizontal line has been made around the value line of $60,000 to denote probable formidable zones toward getting decent longing entries as the BTC/USD trade decreases, tending to find support around the point.
Fearful downward pressure throughout yesterday’s sessions resulted in panic sells for a while below the $65,000 mark. To dowse the moves, a bullish candlestick has been developing in the interim. And on that basis, bulls are probably gradually regaining dominance at this point.
It has been observed that selling activity in the Bitcoin vs. US dollar market has reached risky levels and may not decline much more, particularly below the key level of $65,000. Should that assumption need to be disproved, price movement must resurface below the lower Bollinger Band in order to exert pressure on bulls.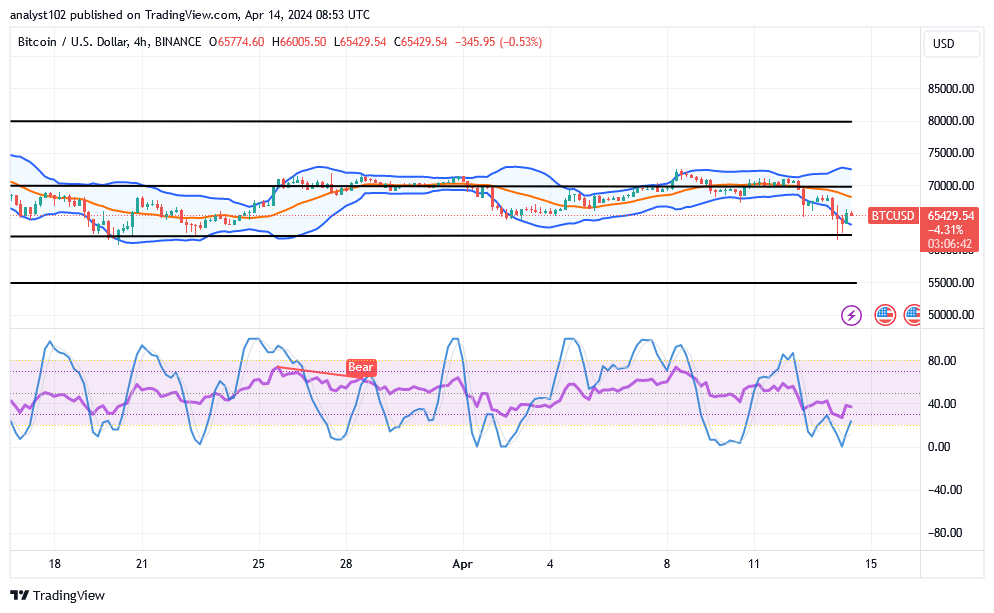
BTC/USD 4-hour Chart
The BTC/USD 4-hour chart reveals the cryptocurrency market is decreasing, tending to find support close to the level of $60,000.
The stochastic oscillators have succeeded in diverging into the oversold area to the south on their paths. If the price tends to make consistent positive moves against the $70,000 line in the near future, the Bollinger Band trend lines are positioned advantageously to suggest that this line will be the critical barrier location to obtain optimal moves.
Note: Cryptosignals.org is not a financial advisor. Do your research before investing your funds in any financial asset or presented product or event. We are not responsible for your investing results.
You can purchase Lucky Block here. Buy LBLOCK