Bitcoin (BTC/USD) Price Is in $70,000 and $60,000, Holding in Ranges
Estimated Reading Time: 3 minutes
Don’t invest unless you’re prepared to lose all the money you invest. This is a high-risk investment and you are unlikely to be protected if something goes wrong. Take 2 minutes to learn more
Bitcoin Price Prediction – April 3
A pit stop of price actions around a higher trading zone has now been regenerated to showcase that the BTC/USD market presently is between $70,000 and $60,000, given that the exchange line is holding in ranges.
The capacity pace of declining forces in the market has only made an impact to push for baseline rebuilding formation around the lower Bollinger Band trend line with an imaginary support line staging below the indicator to play a supportive role. Upon noticing this circumstance, purchasers can ask to resume desiring position orders, given that the value holds firm against any attempts to impede the move.
BTC/USD Market
Key Levels:
Resistance levels: $70,000, $72,500, $75,000
Support levels: $60,000, $57,500, $55,000
BTC/USD – Daily Chart
The BTC/USD daily chart showcases the crypto market in $70,000 and $60,000 bargaining spots, holding in ranges.
The Bollinger Band trend lines have stretched northward to provide a variant strategic resistance line slightly above the point of $70,000 and at the lower side of $60,000. The stochastic oscillators have been in a state of southbound-crossing mode, aiming to approach the range of 20. With a smaller bullish candlestick in the making, that indicates that falling force in the market tends not to future more aggressively as it has begun to turn from an all-time high point recently.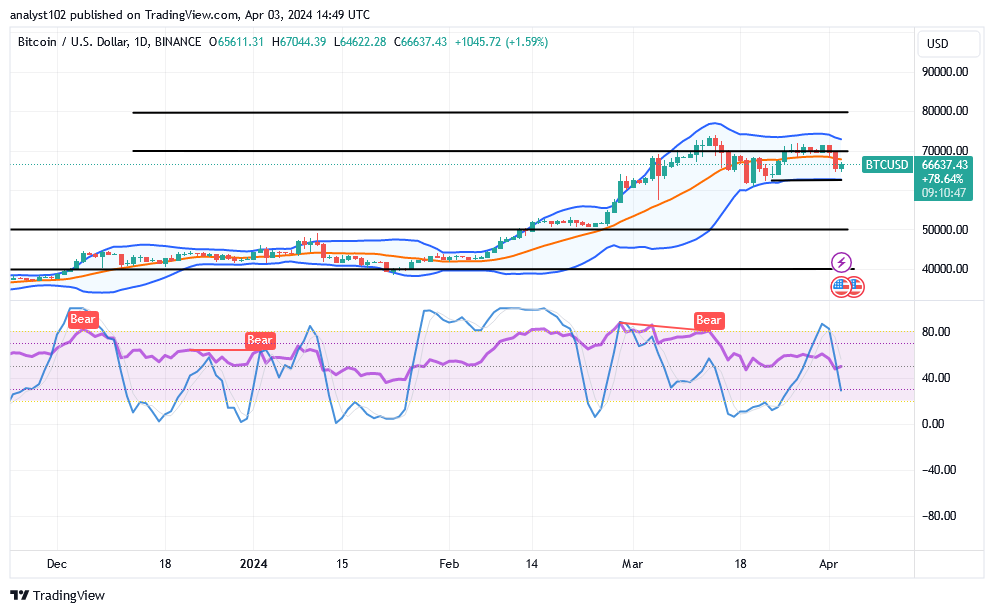
Given that the BTC/USD market is staying in bands of $70,000 and $60,000, would a frightening southbound breach stage against the $60,000 line?
There has been a signal to suggest that bulls are in the process of regaining a swing high, as the BTC/USD market is between $70,000 and $60,000, holding in ranges.
While the price isn’t putting more force on the lower Bollinger Band’s trade point, the bullish movement on today’s candlestick has been a sign of possible buy entries. Should that supposition prove to be accurate, purchase orders would need to be placed before dial rallying motions can start up again.
It has been shown over the course of a few sessions that there is still a stronger retardation line near the $70,000 mark. Sellers will need to refasten their belts between the upper and a higher point of $80,000 while other positive volatile moves get exhausted if a slow and steady climb is made to break past the value line in the long term.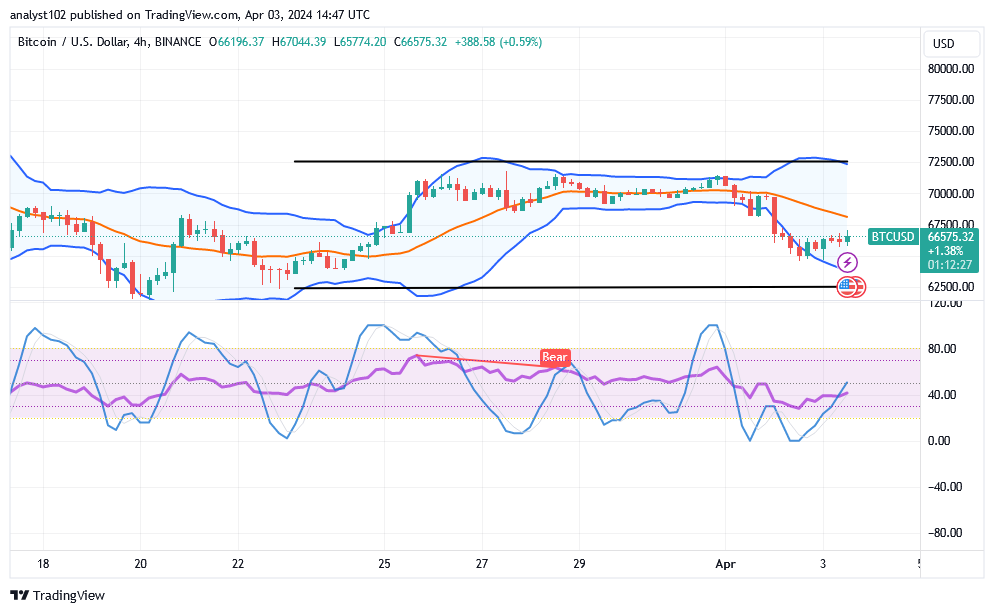
BTC/USD 4-hour Chart
The BTC/USD 4-hour chart reveals the crypto-economic market is between $70,000 and $60,000, holding in ranges.
The lower Bollinger Band trend lines’ medium-term arrangement pattern has extended southward, showing indications of potential dips and extinction near the $60,000. Observations of the stochastic oscillators attempting to veer northward from different oversold areas indicate that long-position pushers are attempting to rally.
Note: Cryptosignals.org is not a financial advisor. Do your research before investing your funds in any financial asset or presented product or event. We are not responsible for your investing results.
You can purchase Lucky Block here. Buy LBLOCK