Bitcoin (BTC/USD) Market Continues to Feature in $65,000 and $60,000
Estimated Reading Time: 3 minutes
Don’t invest unless you’re prepared to lose all the money you invest. This is a high-risk investment and you are unlikely to be protected if something goes wrong. Take 2 minutes to learn more
Bitcoin Price Prediction – November 7
It indicated that the BTC/USD market activity continues to feature in $65,000 and $60,000 levels. The crypto possesses a percentage rate of 0.29, trading around $61,972. As of writing, the market records a high value of $62,669 and a lower point of about $61,386.
BTC/USD Market
Key Levels:
Resistance levels: $65,000, $67,500, $70,000
Support levels: $60,000, $57,500, $55,000
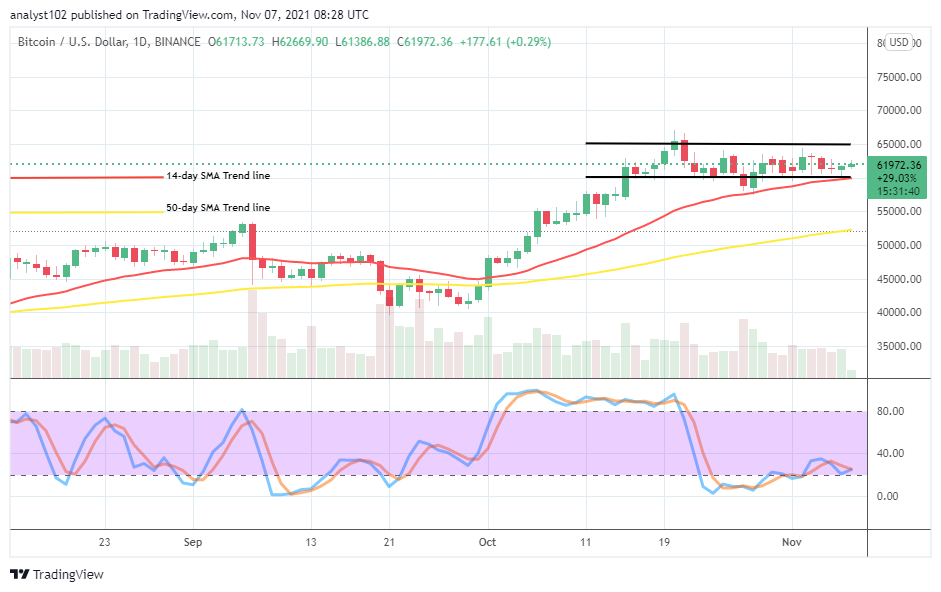
BTC/USD – Daily Chart
The BTC/USD daily chart reveals that the market continues to feature in $65,000 and $60,000 range-bound zones over several days’ sessions. All the activities are on the buy signal side of the SMA indicators. The 14-day SMA trend line is above the 50-day SMA trend line. The Stochastic Oscillators are in the ranges of 40 and 0. And, they now attempt to cross the lines northbound over the range of 20. That indicates that some buying intrigues are in the loom.
Should traders hold on to range-bound trading ethics as the BTC/USD market continues to feature in $65,000 and $60,000 levels?
It appears technically inclined that traders keep to range-bound trading ethics as the BTC/USD market continues to feature in $65,000 and $60,000 levels over a couple of several sessions. Traders needed to exercise so much cautiousness at a psychological mid-value line at $62,500. The most reliable trading support baseline remains around the lower range level earlier mentioned. Therefore, buyers can keep on to that axis while price tends to downswing toward or around it before considering a buy entry.
On the downside, the BTC/USD intending sellers may get repositioned between a bit over $62,500 and $65,000 levels before considering whether or not to make a re-launch of sell orders. Some active pull-ups are needed to stage until several signs of exhaustion are sighted to confirm that the market, reaching a peak zone for a safe sell entry afterward.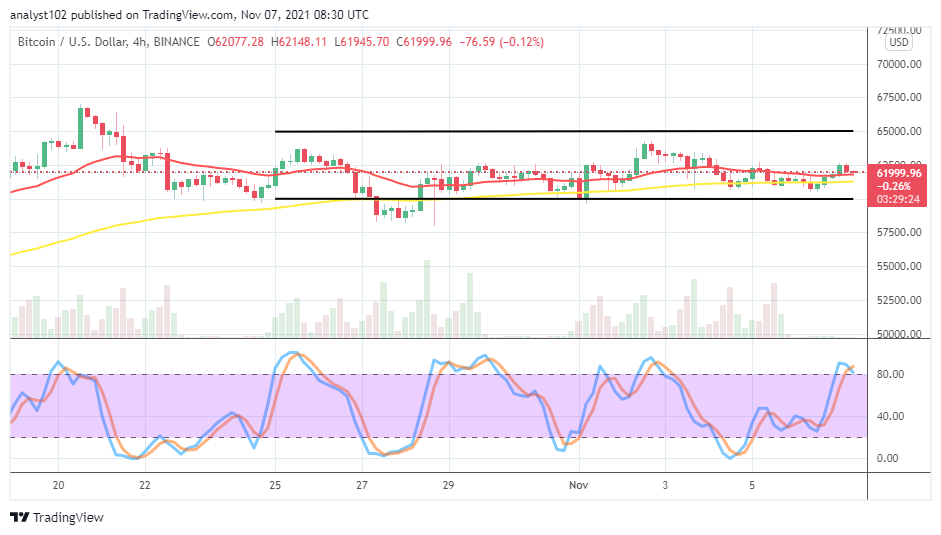
BTC/USD 4-hour Chart
The BTC/USD medium-term chart reveals three main layer value-lines as the market continues to feature in $65,000, $62,500, and $60,000 levels. The 14-day SMA trend line is above the 50-day SMA trend line between the mid-range line and the lower range value line as they point toward the east direction to indicate that a range-bound trading condition is ongoing. The Stochastic Oscillators are at the range of 80, attempting to cross the lines southbound. That signifies that the market tends to downsize in no time. Therefore, buyers to wary of going along with false hiking around the upper range value line to avoid being whipsawed unnecessarily.
Note: Cryptosignals.org is not a financial advisor. Do your research before investing your funds in any financial asset or presented product or event. We are not responsible for your investing results.
You can purchase crypto coins here. Buy Tokens