XRP (XRP/USDT) Hopes to Transit; Will Current $2.0000 Support Hold?
Estimated Reading Time: 3 minutes
Don’t invest unless you’re prepared to lose all the money you invest. This is a high-risk investment and you are unlikely to be protected if something goes wrong. Take 2 minutes to learn more
XRP/USDT Long-term Analysis: Ranging
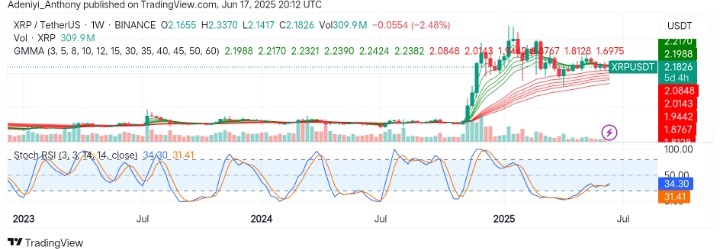
The trading pair, XRP against the Tether, is currently displaying a consolidation pattern on the weekly timeframe after a strong bullish breakout earlier in 2025. However, the recent market sentiment leans towards indecision, as the pair operates within a narrowing range above the Guppy Multiple Moving Averages (GMMAs) cluster.
To this end, the Stochastic RSI indicates a potential for renewed upward movement if momentum builds from current levels. However, the pair’s price closes currently above $2.000 with the traders monitoring the resistance and support levels closely for potential breakout or breakdown opportunities.
Currently, XRP trades at $2.1826, printing over 309 million traded volumes for the week.
XRP Technical Indicators
Major Resistance Levels: $2.2120, $2.3000, and $2.3500
Major Support Levels: $2.0848, $2.0170, and $1.9466
XRP Technical Analysis
The analysis of XRP against the Tether on the weekly chart has shown a strong GMMA alignment with shorter EMAs stacked above longer ones, suggesting the broader trend remains bullish. However, price action has paused into a sideways movement following a steep rise, indicative of a cooling-off phase.
On the other hand, the Stochastic RSI is in the mid-range, currently pointing upward, which may signal building bullish momentum. However, the decline in volume has relatively decreased the breakout chances. However, with consistent buying at higher lows, a close above $2.2120 would validate a bullish breakout, while a breakdown below $2.0170 could indicate a trend reversal.
XRP/USDT Analysis: A Breakout or Continued Sideways Movement?
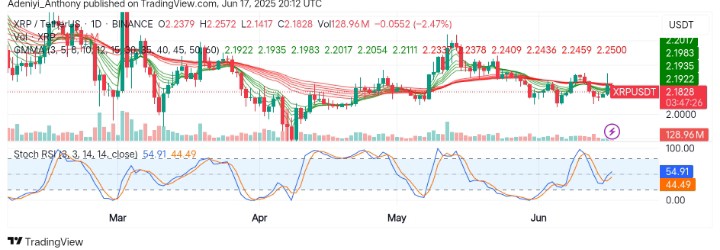
On the daily timeframe, the price of XRP/USDT remains pinned below a compressed GMMA, indicating reduced bullish momentum in the short term. However, the Stochastic RSI has crossed upward with values at 54.91 and 44.49, pointing to potential momentum buildup with the key resistance at $2.2120, while support is found at $2.0848.
Currently, the price is trading near equilibrium, suggesting caution before aggressive entry, as the volume is yet to confirm any breakout or breakdown, reinforcing a wait-and-see approach.
To this end, a decisive move through $2.2130 confirms daily bullish momentum toward upper limits; otherwise, a range-bound situation may continue.
You can purchase crypto coins here. Buy LBlock