Solana (SOL) Price Prediction: SOL/USDT Bearish Retracement Hits Resistance at $185
Estimated Reading Time: 3 minutes
Don’t invest unless you’re prepared to lose all the money you invest. This is a high-risk investment and you are unlikely to be protected if something goes wrong. Take 2 minutes to learn more

Solana (SOL) Price Prediction: February 7
Ever since Solana’s price action nearly hit the $300 price level, headwinds regained strong control of the market. As a result, price action has been falling towards lower support levels and key technical levels. However, the market has hit a three-month-old support level and has rebounded upwards.
SOL/USDT Long-Term Trend: Bearish (Daily Chart)
Key Price Levels:
Resistance: $200, $210, $220
Support: $190, $180, $170
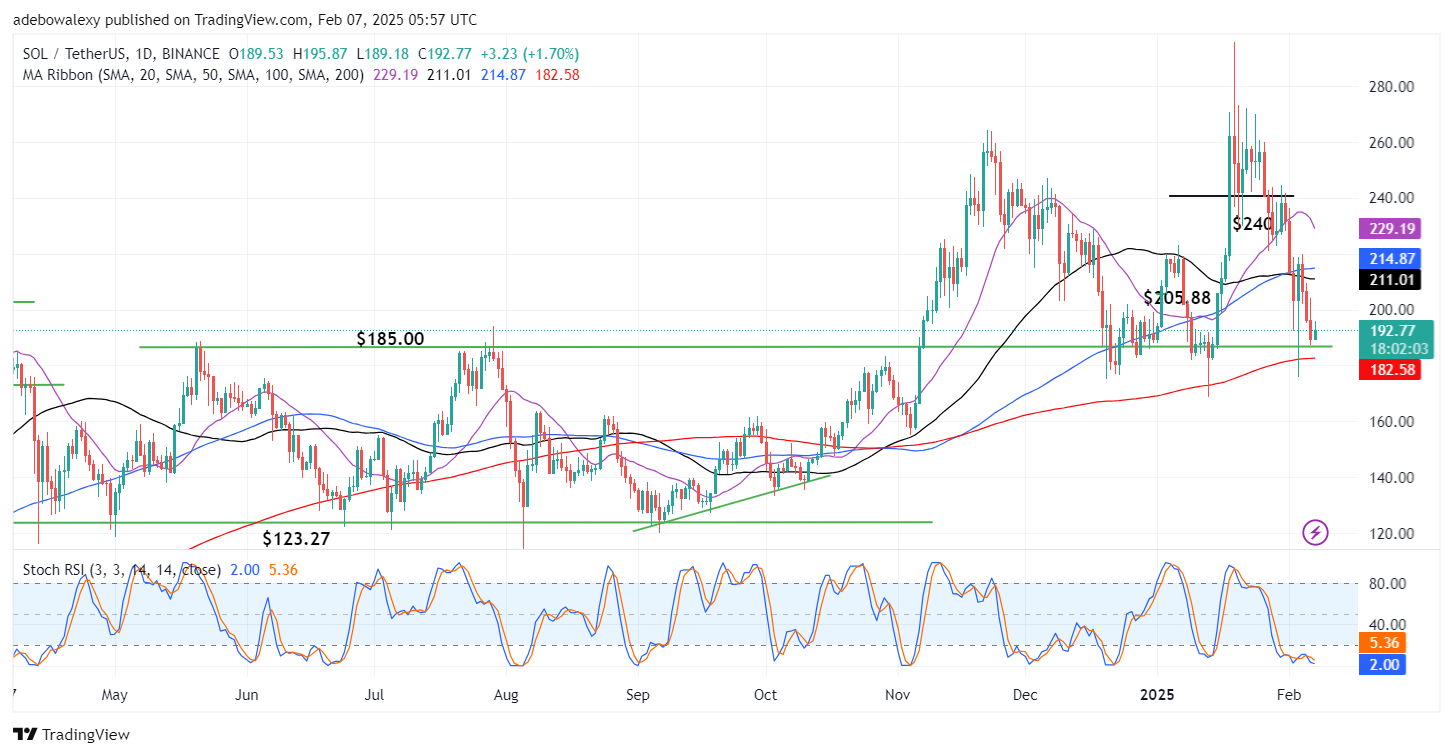
Price action in the Solana daily market now stands just above the 200-day Moving Average (MA) curve. Meanwhile, the last price candle here is green and stands above the $185 threshold level. The mentioned price candle can be seen possessing an upper shadow. At the same time, the Stochastic Relative Strength Index (RSI) lines can be seen to have fallen into the oversold region and now have a sideways trajectory in that region.
Solana (SOL) Price Prediction: SOL/USDT Still Appears Vulnerable
On the Solana daily chart, price action has fallen below most of the MA lines on the chart. The 20-, 50-, and 100-day MA lines can be seen standing above the price action. However, the market only stands above the 200-day MA line. This, in fact, suggests that price action may still be at the disposal of headwinds despite the seen upside retracement in the ongoing session.
The Stochastic RSI lines, too, indicate an oversold condition. Technically, this affirms the vulnerability in the market. However, the sideways trajectory of the terminal part of the indicator lines hints at a potential upside crossover, which may strengthen upside retracements.
Solana (SOL) Price Prediction: Solana May Fall Back Toward the $185 Mark (4-Hour Chart)
While the daily Solana chart has indicated that price action may still be vulnerable, the 4-hour market chart has revealed that the vulnerability may already be taking place. Here, recent price candles have been appearing below all the MA lines on the chart. Likewise, the last price candle here is red, which indicates that downward forces are once more in the lead.
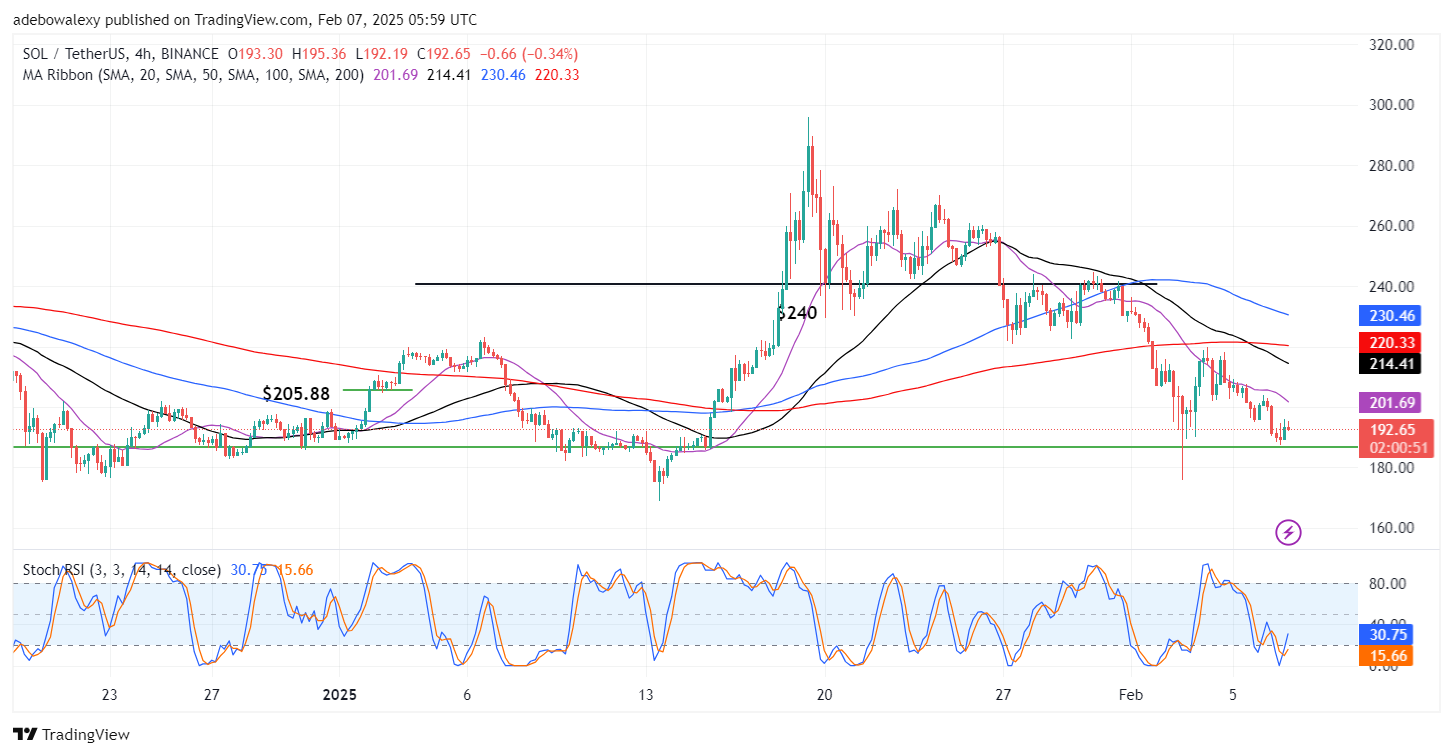
Nevertheless, the Stochastic RSI lines can be seen still keeping to an upward trajectory from the oversold region. At this point, despite the upside trajectory of the Stochastic RSI lines, it seems likely that the market will proceed downward, seeing the appearance of the last price candle as well as the position of the last price candle on the chart. Therefore, traders can prepare to see price action here hitting the $185 price level and possibly approaching the $180 price mark.