Ripple Reaches Bullish Trend Zone, May Overcome Recent Highs
Estimated Reading Time: 2 minutes
Don’t invest unless you’re prepared to lose all the money you invest. This is a high-risk investment and you are unlikely to be protected if something goes wrong. Take 2 minutes to learn more

Ripple (XRP) Long-Term Analysis: Bearish
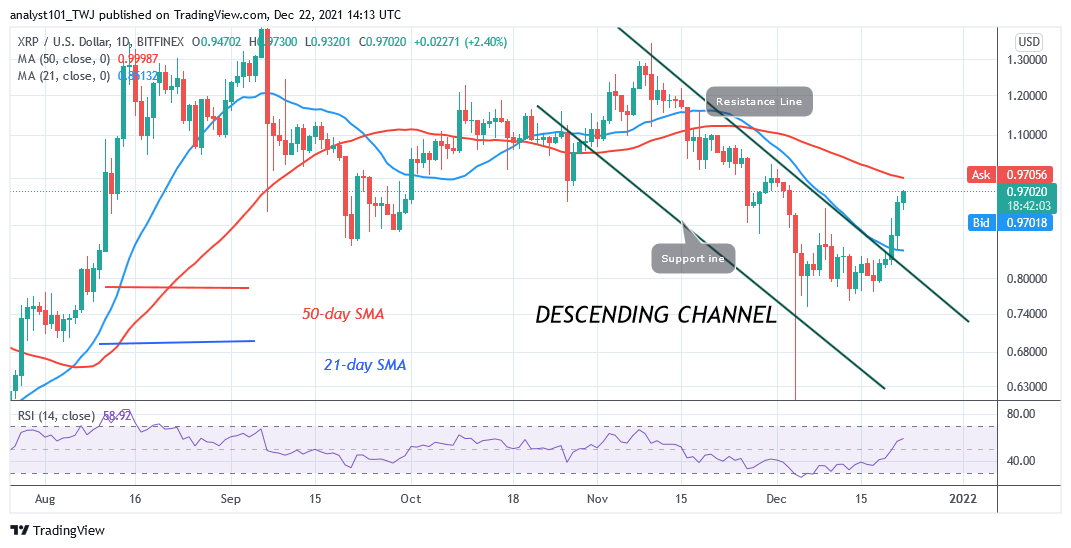
Ripple’s (XRP) price has broken above the 21-day line moving average and it may overcome recent Highs .Also, it is approaching to break above the 50-day line moving average. A break above the 50-day line moving average will signal the resumption of upside momentum. The uptrend is likely to face resistance at $1 or $1.10 high. When buyers are successful, XRP will resume upside momentum and retest the previous high of $1.30 high. On the other hand, if the bulls face rejection at the 50-day line moving average, XRP will be compelled to a range-bound move. Ripple will be fluctuating between the moving averages pending the outcome of a breakout.
Ripple (XRP) Indicator Analysis
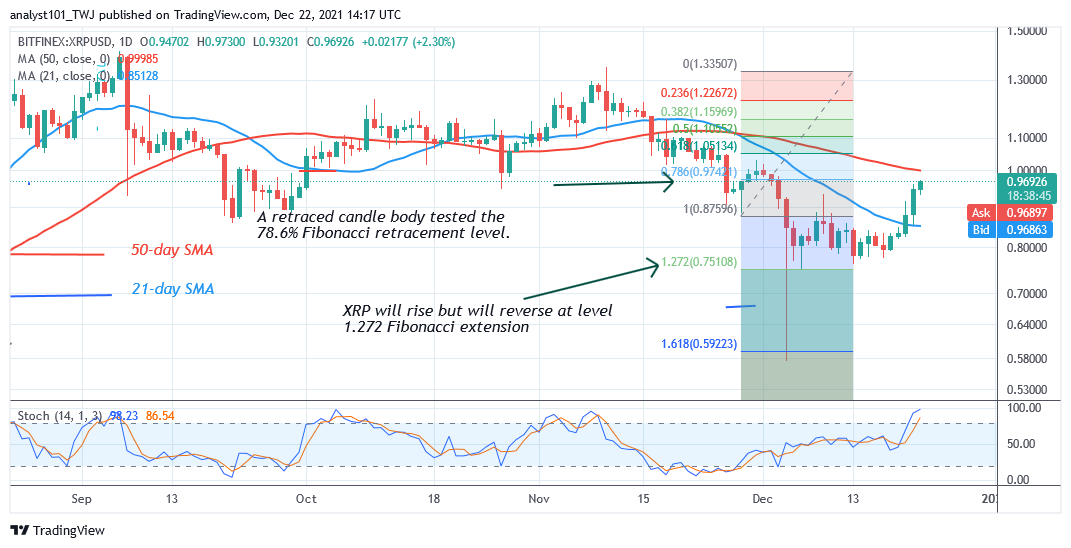
Ripple price has broken and closed above the resistance line of the descending channel. This implies that the downtrend has been terminated. Buyers have taken control of prices. Ripple has risen to level 58 of the Relative Strength Index for period 14. It indicates that the altcoin is in the uptrend zone and above the centerline 50. Ripple is above the 80% range of the daily stochastic. It implies that the market has reached the overbought region. Sellers may emerge in the overbought region to push prices down.
Technical indicators:
Major Resistance Levels – $2.00, $2.50, $3.00
Major Support Levels – $1.50, $1.00, $0.50
What Is the Next Direction for Ripple (XRP)
Ripple’s (XRP) price is in an upward move and it may overcome recent Highs. It has recovered above the $0.76 support. The Fibonacci tool analysis has been achieved. Ripple has reversed from level 1.272 Fibonacci extension or $0.76. The uptrend will be established when buyers break above the moving averages.
You can purchase crypto coins here. Buy Tokens
Note: Cryptosignals.org is not a financial advisor. Do your research before investing your funds in any financial asset or presented product or event. We are not responsible for your investing results