Ripple Hovers Above $0.76 as XRP Reaches an Oversold Region
Estimated Reading Time: 2 minutes
Don’t invest unless you’re prepared to lose all the money you invest. This is a high-risk investment and you are unlikely to be protected if something goes wrong. Take 2 minutes to learn more
![]()
Ripple (XRP) Long-Term Analysis: Bearish
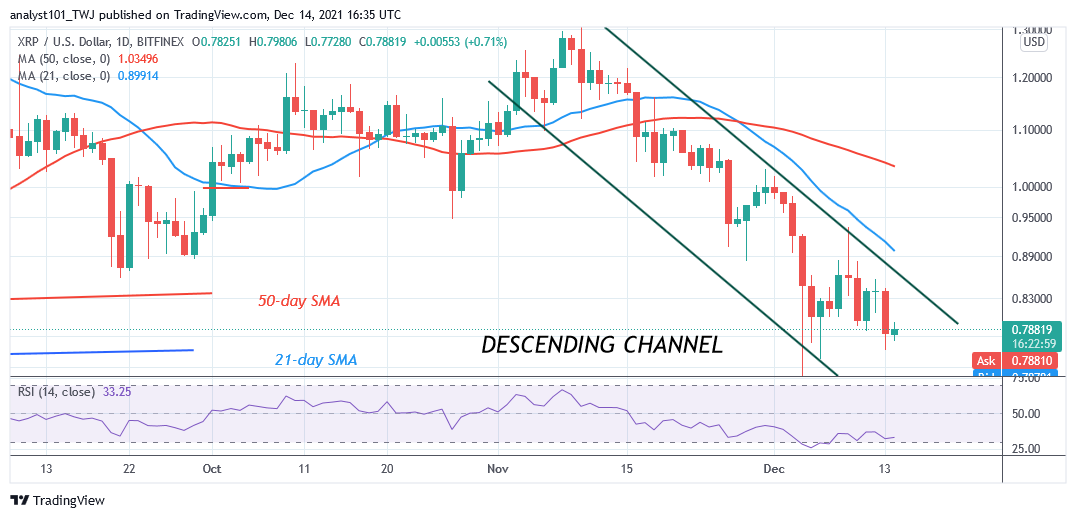
Ripple’s (XRP) price has been consolidating above the $0.76 support level since December 4 price breakdown. Ripple has been trading between $0.76 and $0.93 price Levels. The $0.76 support is the previous low of August 8. In August, the market resumed an upward move to reach the previous high of $1.30.The cryptocurrency will resume an uptrend if the bulls break the resistance at $0.93 and $1.10. When buyers are successful, XRP will resume upside momentum and retest the $1.30 high. When buyers fail to breach the recent high, the range-bound move between $0.76 and $0.93 will continue.
Ripple (XRP) Indicator Analysis
Ripple is at level 36 of the Relative Strength Index for period 14. It indicates that the altcoin is in the downtrend zone and below the centerline 50. On December 4 price down, XRP reached the oversold region and pulled back.XRP/USD is below the 50% area of the daily stochastic. The market is in a bearish momentum.
Technical indicators:
Major Resistance Levels – $2.00, $2.50, $3.00
Major Support Levels – $1.50, $1.00, $0.50
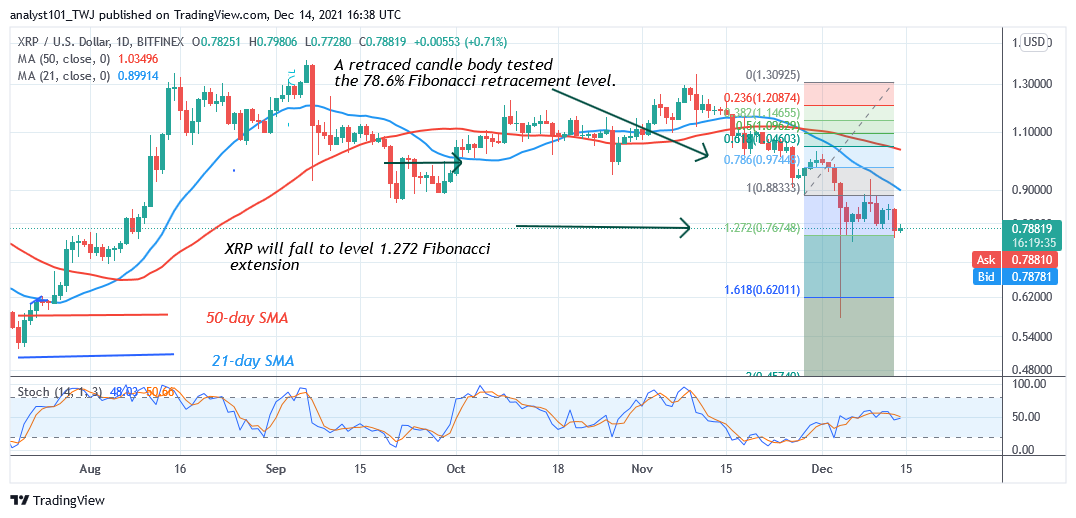
What Is the Next Direction for Ripple (XRP)
Ripple’s (XRP) price is in a downward move. The downtrend has subsided as price consolidates above $0.76 support. On November 28 downtrend; a retraced candle body tested the 78.6% Fibonacci retracement level. The retracement indicates that XRP price will fall but reverse at level 1.272 Fibonacci extension or $0.76.
You can purchase crypto coins here. Buy Tokens
Note: Cryptosignals.org is not a financial advisor. Do your research before investing your funds in any financial asset or presented product or event. We are not responsible for your investing results