Ripple (XRP) Is in a Downward Correction, May Resume up Trending
Estimated Reading Time: 2 minutes
Don’t invest unless you’re prepared to lose all the money you invest. This is a high-risk investment and you are unlikely to be protected if something goes wrong. Take 2 minutes to learn more

Ripple (XRP) Long-Term Analysis: Bearish
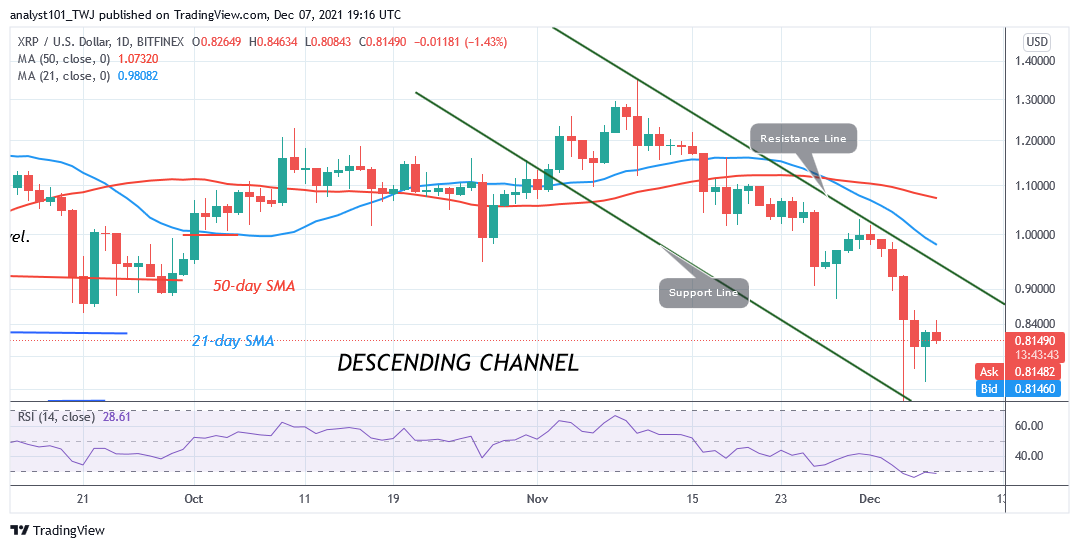
Ripple’s (XRP) price is in a downward correction as price fluctuates between $0.76 and $0.85 price levels. On the upside, if buyers can push XRP above the $1.10 high, it will be out of downward correction. In addition, the bullish momentum can extend to the previous high of $1.20. Conversely, if the bulls face rejection at the $0.85 or $1 resistance, Ripple will fall and resume selling pressure. A break below the $0.76 support will cause the altcoin to decline to the low of $0.57.
Ripple (XRP) Indicator Analysis
Ripple is at level 28 of the Relative Strength Index for period 14. XRP has reached the oversold of the market. The downtrend has reached bearish exhaustion. Buyers are likely to emerge in the oversold region to push prices upward. XRP/USD is above the 50% area of the daily stochastic. The market has resumed bullish momentum.
Technical indicators:
Major Resistance Levels – $2.00, $2.50, $3.00
Major Support Levels – $1.50, $1.00, $0.50
What Is the Next Direction for Ripple (XRP)
According to the price indicator, XRP/USD has reached bearish exhaustion. From the price action, the long candlestick tail indicates strong buying pressure above the support levels. Meanwhile, on November 28 downtrend; a retraced candle body tested the 78.6% Fibonacci retracement level. The retracement indicates that XRP price will fall but reverse at level 1.272 Fibonacci extensions or $0.76.

You can purchase crypto coins here. Buy Tokens
Note: Cryptosignals.org is not a financial advisor. Do your research before investing your funds in any financial asset or presented product or event. We are not responsible for your investing results


