SPONGE/USD ($SPONGE): Buyers Regroup at $0.0001374
Estimated Reading Time: 2 minutes
Don’t invest unless you’re prepared to lose all the money you invest. This is a high-risk investment and you are unlikely to be protected if something goes wrong. Take 2 minutes to learn more
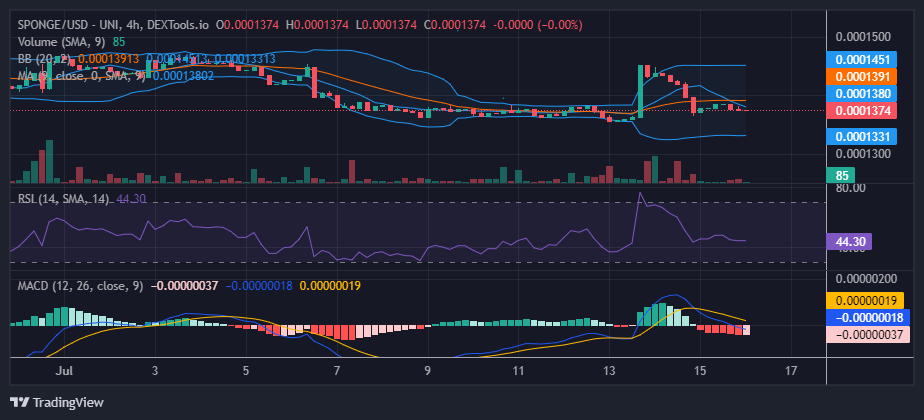
Recently, the SPONGE/USD bulls propelled the market above the $0.00014 price level as demand exceeded supply. However, bulls could not follow through, possibly because of the relatively low volume of trade in the last 24 hours. So, the price fell to $0.0001374. A strong baseline for bullish action may reoccur here, and the market may reattempt the $0.00014 resistance level from here.
Key Levels
- Resistance: $0.0004, $0.0045, and $0.0005.
- Support: $0.00013, $0.00012, and $0.00011
Sponge (SPONGE/USD) Price Analysis: The Indicators’ Point of View
The SPONGE/USD price retracement has brought the market slightly below the 20-day moving average and the 9-day moving average. This means supply slightly exceeds demand due to the significant price retracement. In the Relative Strength Index (RSI), the market currently ranges at level 44. The fact that the market ranges at this level is a pointer to an imminent price reversal. The support level is being strengthened for that.
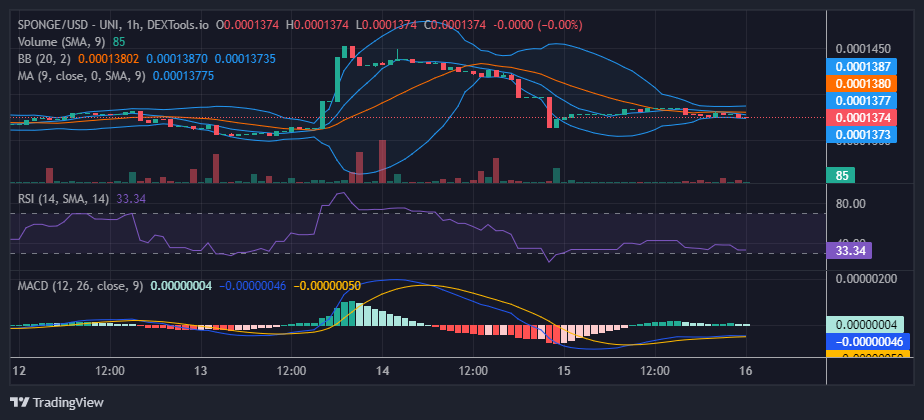
$SPONGE Short-Term Outlook: 1-Hour Chart
From a 1-hour chart standpoint, the market consolidates along the support level. The Bollingeer Bands converge against the price action. This is a sign that the market is about to see a price breakout. Most likely, this could be in the upside direction because the indecision is taking place along the edge of the support level.
All you need to do is install Metamask, and you can explore the world of NFTs.
Gas fees always causing trouble… 😩💸 pic.twitter.com/03d5KPRecy
— $SPONGE (@spongeoneth) July 15, 2023
Invest in the hottest and best meme coin. Buy Sponge ($SPONGE) today!