The Orca Market (ORCA/USD) Surges Past $2.50, Reasserting Dominance
Estimated Reading Time: 3 minutes
Don’t invest unless you’re prepared to lose all the money you invest. This is a high-risk investment and you are unlikely to be protected if something goes wrong. Take 2 minutes to learn more

Approximately two days ago, the Orca market experienced a significant surge, rising from $1.50 to $2.50. This $2.50 level, a key price point, had previously served as a support level in May. After consolidating at this level, bearish pressure ultimately dominated the market. Given the Orca market’s movement on Saturday, a strong bearish trend is anticipated after reaching this critical level. However, many traders quickly took profits, yet the market appears to remain driven by strong bullish sentiment, with buyers continuing to push the market upward.
The Orca Market Data
- ORCA/USD Price Now: $2.85
- ORCA/USD Market Cap: $146 million
- ORCA/USD Circulating Supply: 51 million
- ORCA/USD Total Supply: 100 million
- ORCA/USD CoinMarketCap Ranking: #290
Key Levels
- Resistance: $3.00, $3.50, and $4.0
- Support: $2.20, $2.00, and $1.50.
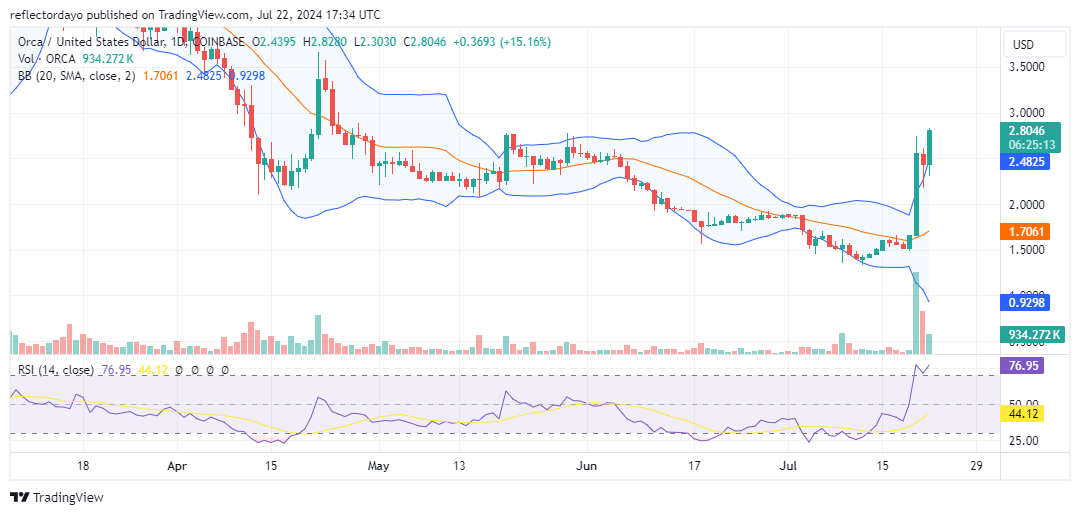
The Orca Market Through the Lens of Indicators
An underlying force is driving the market, as observed in today’s trading session. After holding steady at the key $2.50 price level, the market has significantly broken out. As it approaches the $3.00 threshold, more traders may adopt a bullish bias. Given that the Relative Strength Index (RSI) currently indicates a volatility level above 70, traders may be waiting for the market to correct itself and establish a higher support level before riding the wave to around $3.00. However, it is important to note that the Bollinger Bands are signaling high volatility in the crypto market.
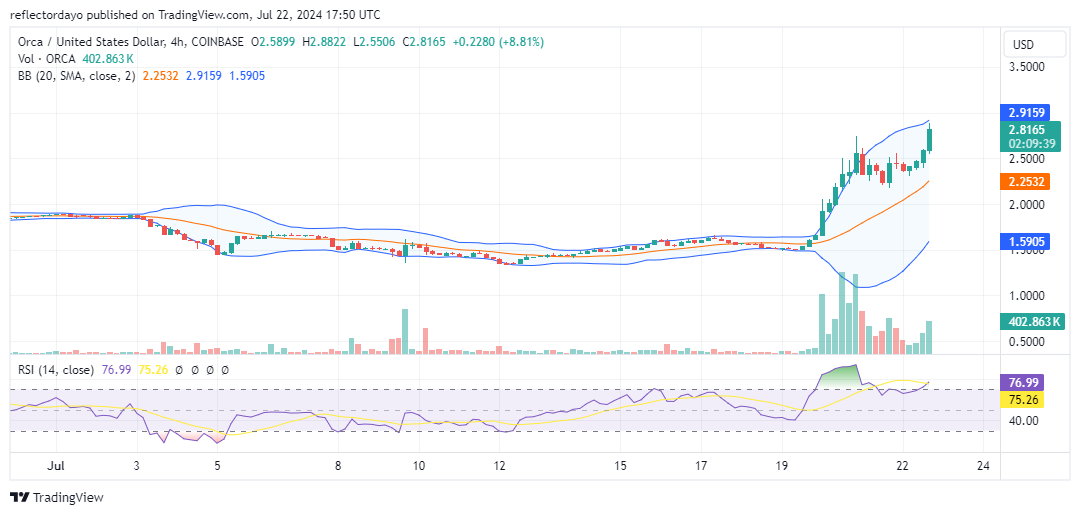
ORCA/USD Price Prediction: 4-Hour Chart Analysis
Demand and supply struggled for a considerable period at the $2.50 price level before the bull market eventually gained the upper hand, driving the market upward. In the daily chart, the Relative Strength Index (RSI) also indicates an overbought market condition, with the RSI line measuring above the 70 level. Additionally, the faster RSI line has crossed above the slower one, suggesting potential for more bullish action. More overbought market activity is expected, as the market appears poised to continue toward the $3.00 price level. Unlike the daily chart analysis, the Bollinger Bands now illustrate an upward-trending market. However, the substantial bandwidth indicates significant volatility, predominantly in favor of the bull market. There may be an underlying factor influencing this market movement.