Uniswap (UNI) Price Prediction: UNI/USDT Downward Correction Cools Below $10.00
Estimated Reading Time: 3 minutes
Don’t invest unless you’re prepared to lose all the money you invest. This is a high-risk investment and you are unlikely to be protected if something goes wrong. Take 2 minutes to learn more

Uniswap (UNI) Price Prediction: February 6
The Uniswap market has been experiencing an extended downward correction, causing the token to fall through multiple support levels. This correction has been significant, bringing the price below a three-month-old resistance level.
UNI/USDT Long-Term Trend: Bearish (Daily Chart)
Key Price Levels:
Resistance: $10.00, $12.00, $14.00
Support: $8.00, $6.00, $4.00
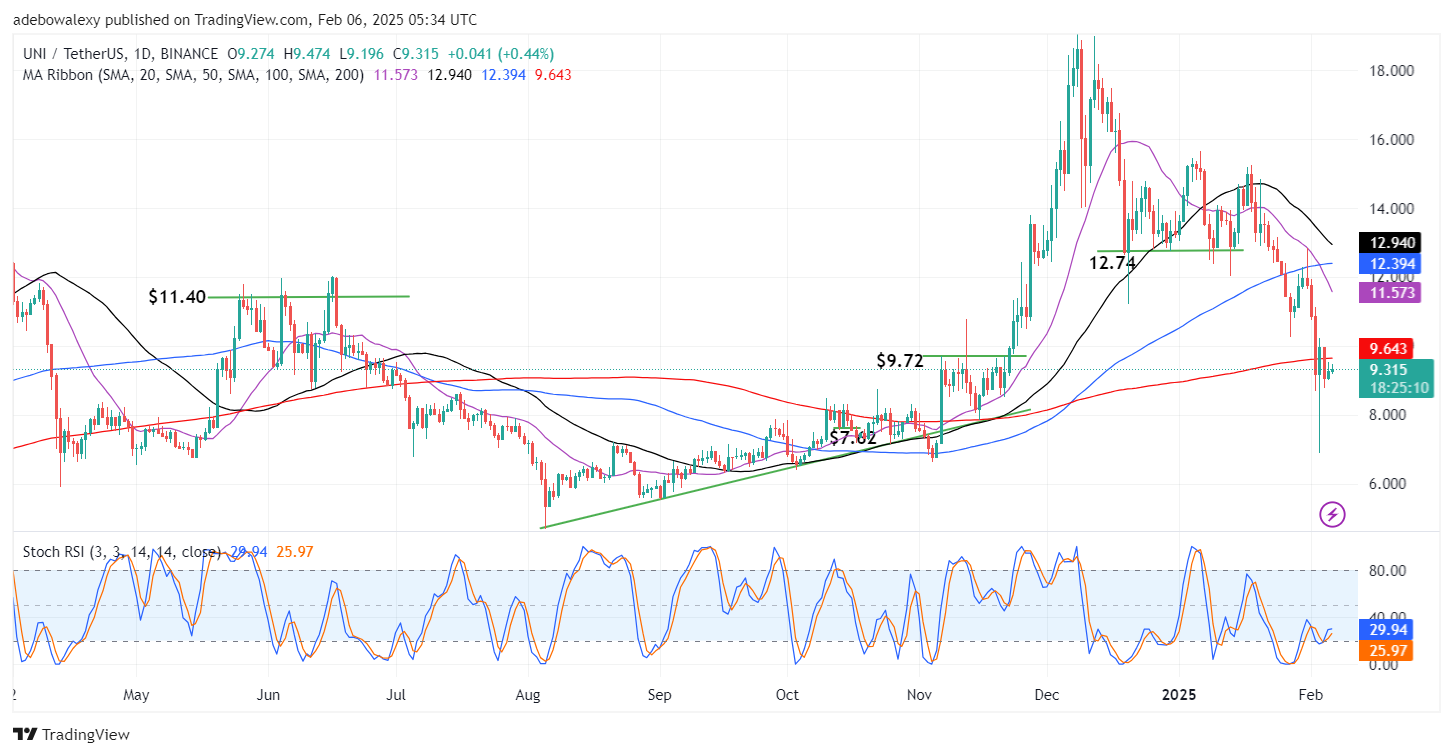
Currently, price action in the Uniswap daily market is oscillating just below the $10.00 threshold. Nevertheless, the price is rebounding minimally below all the Moving Average (MA) lines. Additionally, the upside retracement appears to be losing momentum, as indicated by the appearance of the corresponding price candles. Furthermore, the Stochastic Relative Strength Index (RSI) lines still have a general upward trajectory. However, the lead line appears slightly deflected, suggesting potential weakness in the retracement.
Uniswap (UNI) Price Prediction: UNI/USDT May Descend Lower
With price activity in the Uniswap daily market now positioned below all the MA lines, downward pressure may strengthen. Over the past sessions, the price has fallen through multiple support levels. However, more recently, the market has been attempting to retrace higher price levels.
That said, the mentioned upside retracement appears quite weak, as trading activity remains below all the MA lines. Nevertheless, the recent retracement has had some impact on the Stochastic RSI indicator, keeping its lines on an upward trajectory. However, the overall market position continues to indicate a strong bearish sentiment for future price movement.
Uniswap (UNI) Price Prediction: Uniswap Hugs the 20-Day MA (4-Hour Chart)
Price action on the Uniswap 4-hour chart can be seen hugging the 20-day MA line. However, the price candles interacting with the MA lines are quite small, indicating low participation. Meanwhile, trading activity remains below most of the MA curves, dampening bullish hopes in this market.
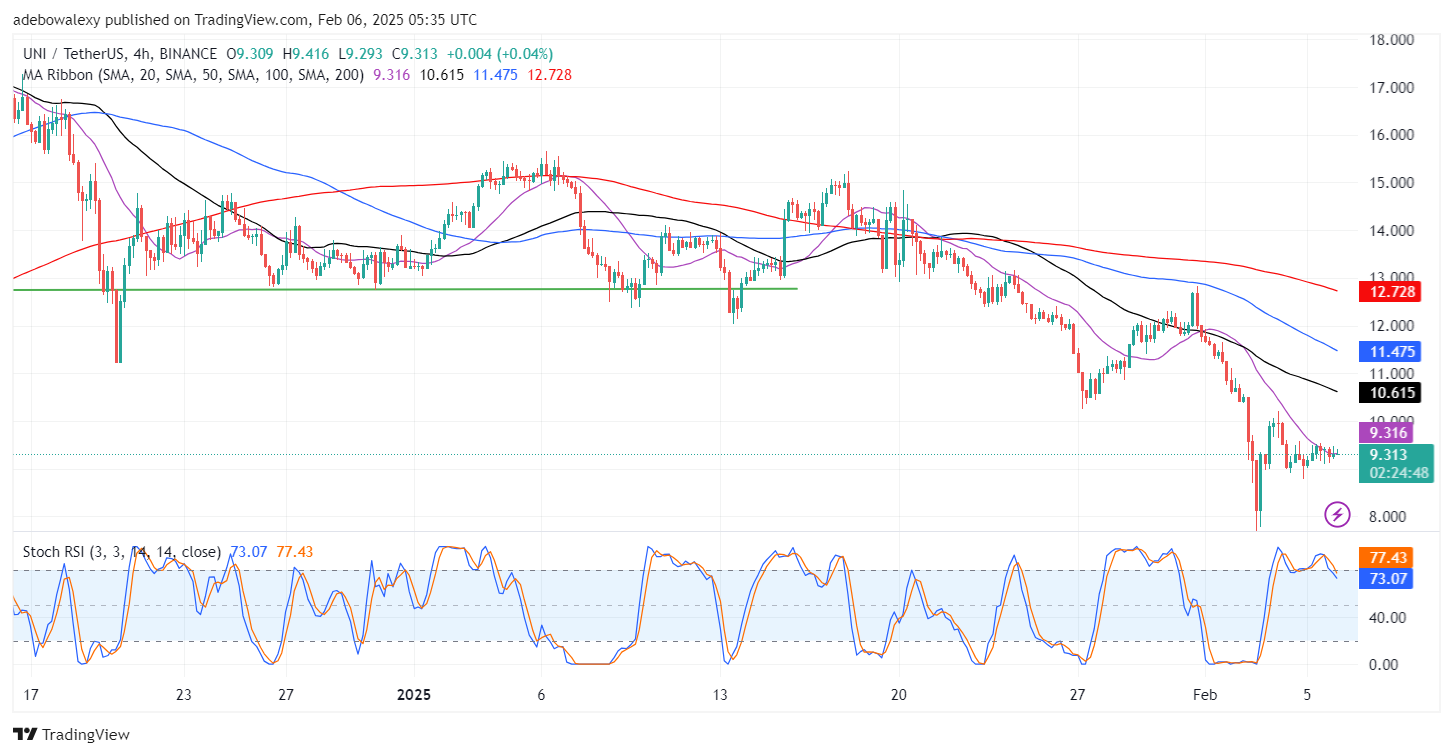
Additionally, the Stochastic RSI lines are falling below the 80 mark, signaling weakening momentum. Based on these indicators, downward forces still appear dominant. The positioning of the recent price candles, combined with the trajectory of the Stochastic RSI lines, suggests that this market still holds bearish potential. Therefore, traders can anticipate the market approaching the psychological $9.00 mark.