Bitcoin (BTC) Price Prediction: BTC/USDT Trades Below Key Levels
Estimated Reading Time: 3 minutes
Don’t invest unless you’re prepared to lose all the money you invest. This is a high-risk investment and you are unlikely to be protected if something goes wrong. Take 2 minutes to learn more

Bitcoin (BTC) Price Prediction: February 5
Price action in the Bitcoin daily market has been consistently retreating below the $100K mark. Currently, the market trades below the $98K level. Additionally, the price candle for the current session appears compressed below key technical levels.
BTC/USDT Long-Term Trend: Bearish (Daily Chart)
Key Price Levels:
Resistance: $100,000, $110,000, $120,000
Support: $97,000, $90,000, $85,000

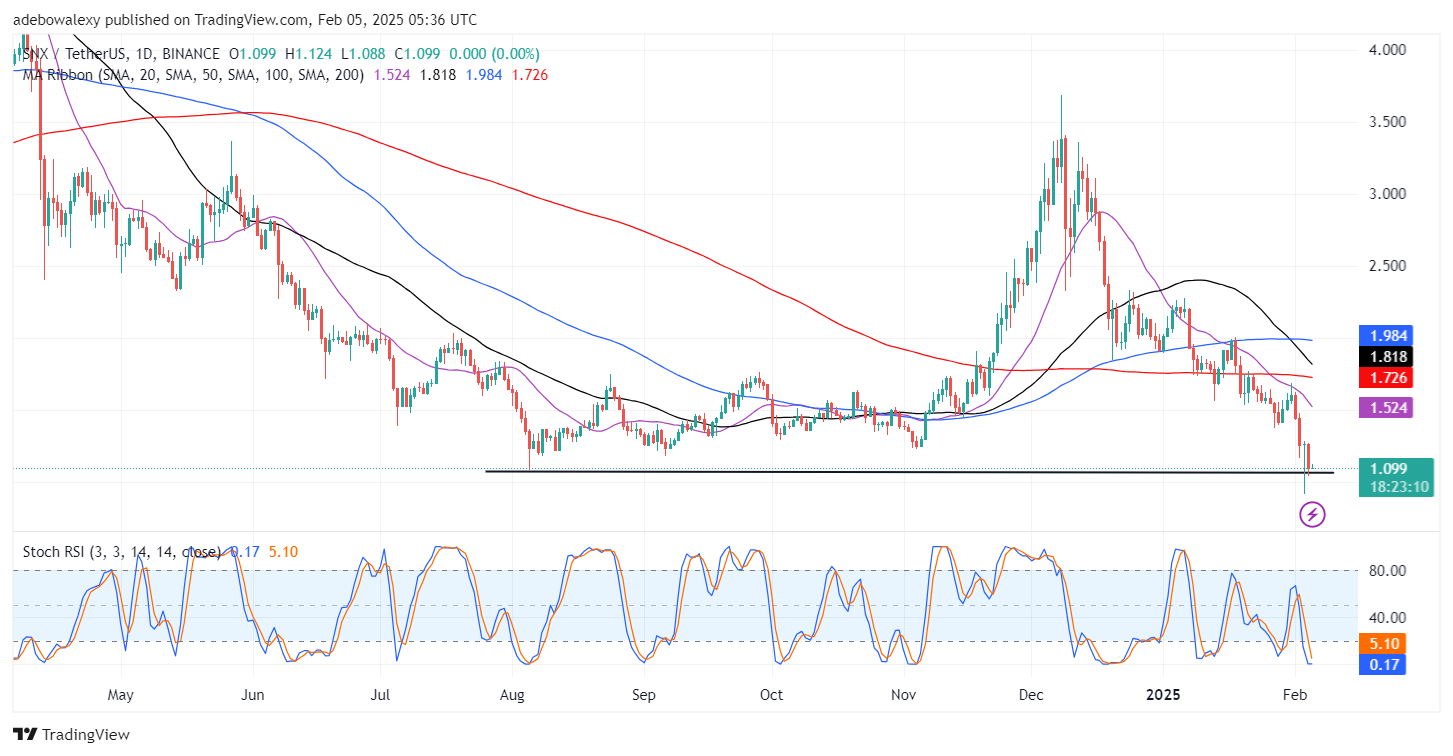
The current session’s price candle remains green at the time of writing, but its body is compressed. Furthermore, price action is trading below the 20- and 50-day Moving Average (MA) lines, which have already crossed. In contrast, the Stochastic Relative Strength Index (RSI) lines are following an upward trajectory, although they remain in the oversold region. This suggests that bearish headwinds continue to dominate.
Bitcoin (BTC) Price Prediction: BTC/USDT on the Verge of Breaching the $100K Mark
Although activities in the Bitcoin daily market remain above long-term technical levels, the short-term outlook appears bearish. This assessment is based on the fact that price action is below the 20- and 50-day MA lines, which have crossed and are contributing to a bearish influence in the market.
Moreover, the Stochastic RSI lines are still projected upward—primarily due to the earlier observed upside retracement, which has now been overcome by bearish pressure. Consequently, headwinds are likely to continue exerting considerable influence on price movement.
Bitcoin (BTC) Price Prediction: Bitcoin Bears Eye Lower Targets (4-Hour Chart)
The BTC 4-hour market reinforces the previously mentioned short-term bearish outlook. Here, price action is trading below all the MA lines on the chart, and the current session is represented by a bearish price candle that appears somewhat contracted.
Additionally, the Stochastic RSI lines are trending downward, though they remain above the 50 threshold. Consequently, from a technical standpoint, bearish forces are likely to gain momentum, potentially driving the market lower to around $95,000. However, relevant fundamentals may offer some support in this market.