Litecoin (LTC) Price Prediction: LTC/USDT Set to Revisit the $98.00 Mark
Estimated Reading Time: 3 minutes
Don’t invest unless you’re prepared to lose all the money you invest. This is a high-risk investment and you are unlikely to be protected if something goes wrong. Take 2 minutes to learn more

Litecoin (LTC) Price Prediction: February 4
Price action in the Litecoin daily market has encountered tremendous headwinds. This is evident from the sharp downward retracement observed in price activity on the chart. Additionally, technical indicators suggest a potential further decline in price.
LTC/USDT Long-Term Trend: Bearish (Daily Chart)
Key Price Levels:
Resistance: $120, $140, $160
Support: $100, $90, $80
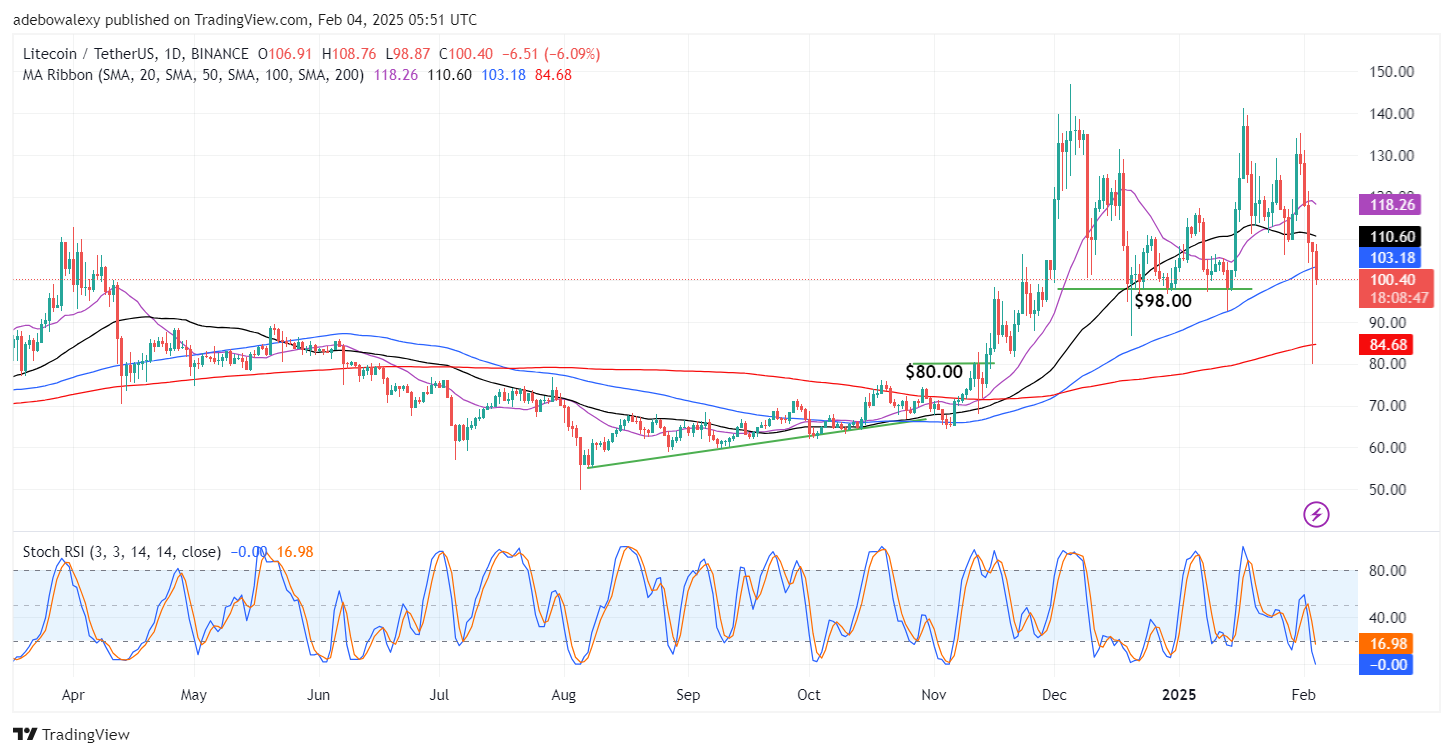
In the Litecoin daily market, bears have seized control of price movement. This downtrend began when price action failed to break through the $120 resistance level. Over the past four sessions, the market has continued retracing lower levels.
As of the time of writing, price action has fallen below the 100-day Moving Average (MA) line, reinforcing the bearish outlook. Furthermore, the Stochastic RSI lines are plunging deeper into the oversold region, indicating sustained downward momentum.
Litecoin (LTC) Price Prediction: LTC/USDT on the Verge of Breaching the $100 Mark
The Litecoin market remains strongly bearish, as price action continues to retrace lower levels. On the daily chart, Litecoin has fallen below three out of four MA lines, confirming strong downward pressure.
Similarly, the Stochastic RSI lines remain depressed, as they continue to fall rapidly into the oversold region. Given the current technical indications, the market remains biased toward further declines. Therefore, traders should respect the prevailing trend and proceed with caution.
Litecoin (LTC) Price Prediction: Bearish Momentum Strengthens (4-Hour Chart)
Extending the Litecoin price analysis to the 4-hour chart, price action has resumed its downward trajectory. This decline follows the recent price dip, which has strengthened bearish momentum. As of the time of writing, selling pressure continues to intensify, pushing the market further downward.
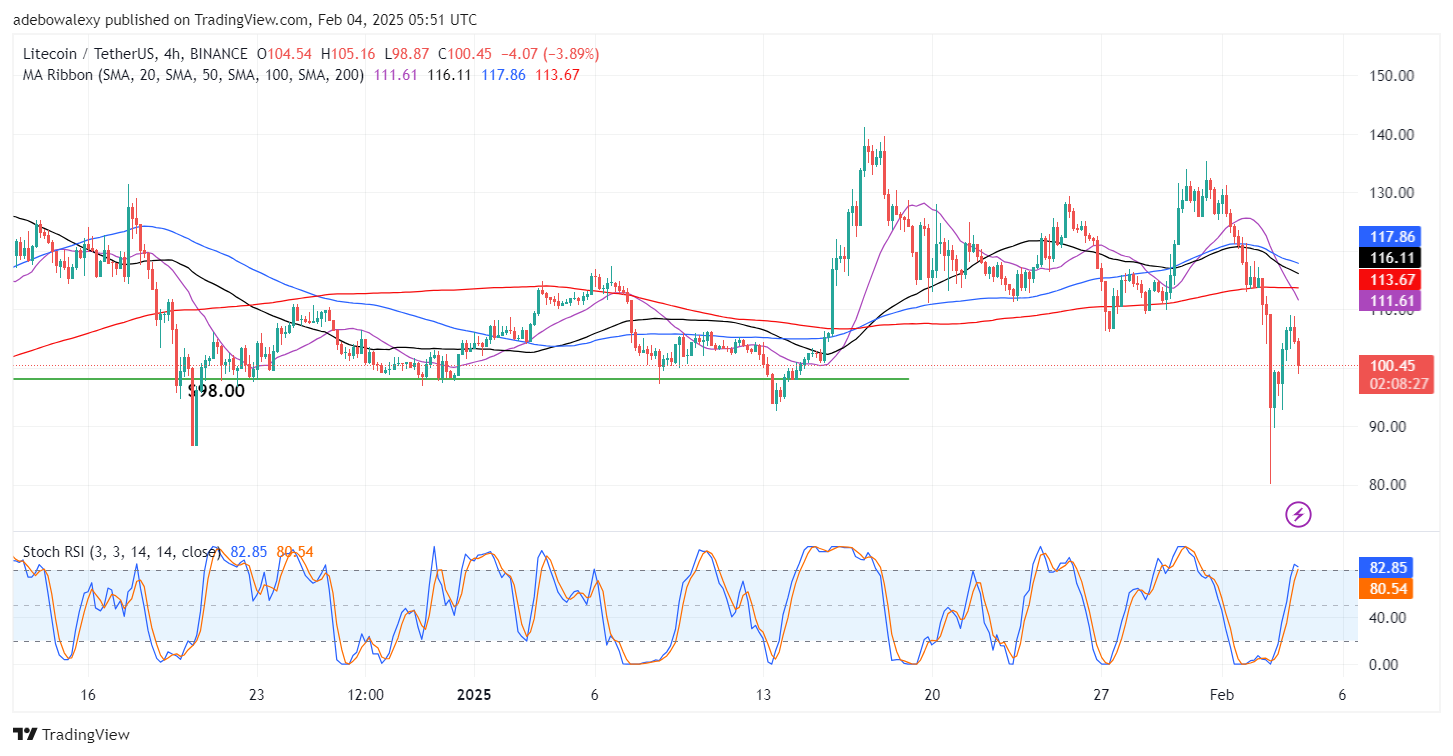
Additionally, the Stochastic RSI lines have risen slightly within the oversold region, with the lead line deflecting downward toward the lagging line, suggesting a trend shift.
Traders should take note that since the downward retracement intensified after the lead line deflected, the market may experience a steeper drop if the indicator lines fully converged. Consequently, traders can target the $90 support level in this market.