Storj Market (STORJ/USD) Bullish Momentum Tested at $0.60
Estimated Reading Time: 3 minutes
Don’t invest unless you’re prepared to lose all the money you invest. This is a high-risk investment and you are unlikely to be protected if something goes wrong. Take 2 minutes to learn more

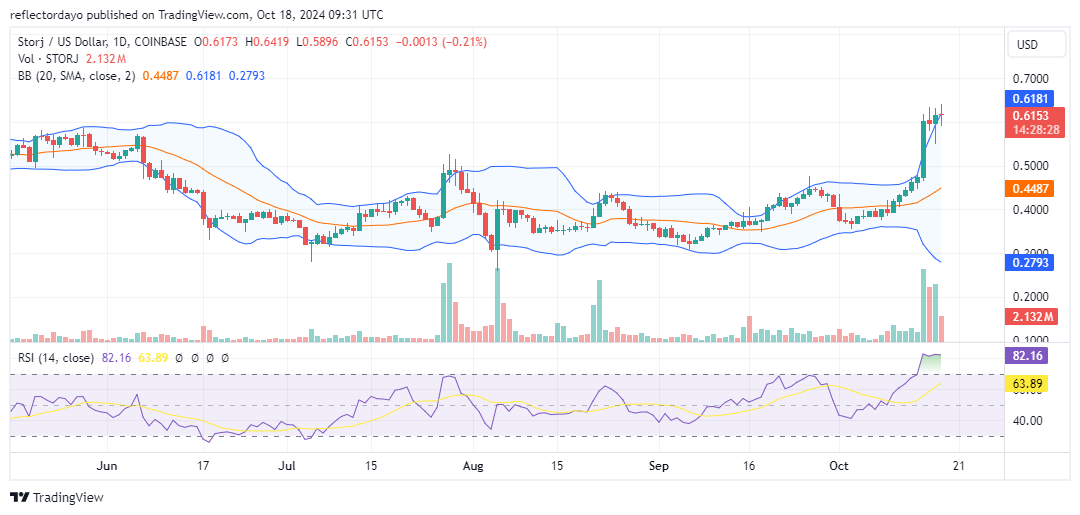
The Storj market had been struggling below the $0.50 price level for an extended period, with bears consistently defending this key resistance. However, on October 15, a significant breakout occurred, driving the market above $0.50. This bullish price action attracted more positive sentiment, propelling the market towards $0.60. As the market approached this level, profit-taking activity began to emerge. Despite this, bullish momentum prevailed, pushing the market above the $0.60 price level.
However, the current market action suggests that bullish momentum may be facing exhaustion above this level. A potential correction could be imminent. Traders should closely monitor price action and technical indicators for signs of a reversal or continuation of the uptrend.
The Storj Market Data
- STORJ/USD Price Now: $0.62
- STORJ/USD Market Cap: $248.4 million
- STORJ/USD Circulating Supply: 398 million STORJ
- STORJ/USD Total Supply: 425 million STORJ
- STORJ/USD CoinMarketCap Ranking: #193
Key Levels
- Resistance: $0.65, $0.70, and $0.75
- Support: $0.55, $0.50, and $0.45.
The Storj Market Through the Lens of Indicators
While the bullish momentum has been driving the market upward, the divergence of the Bollinger Bands indicates escalating market volatility and suggests the potential for a significant price swing. The fact that the market has been able to hold up despite this volatility is a sign of sustained bullishness.
However, the repeated appearance of spinning top candlesticks at the peak of the bullish trend suggests that bullish momentum may be facing exhaustion, increasing the likelihood of a significant correction. Given the high volatility and divergent Bollinger Bands, such a correction could be substantial.
Additionally, the Relative Strength Index (RSI) line has been ranging sideways above the overbought level, specifically at 83. This crypto signal further supports the possibility of a correction.
Despite the potential for a correction in the crypto signal, the significant bullish move suggests that the market may find a higher support level, even above the $0.50 mark, if a correction does occur.
STORJ/USD Price Prediction: 4-Hour Chart Analysis
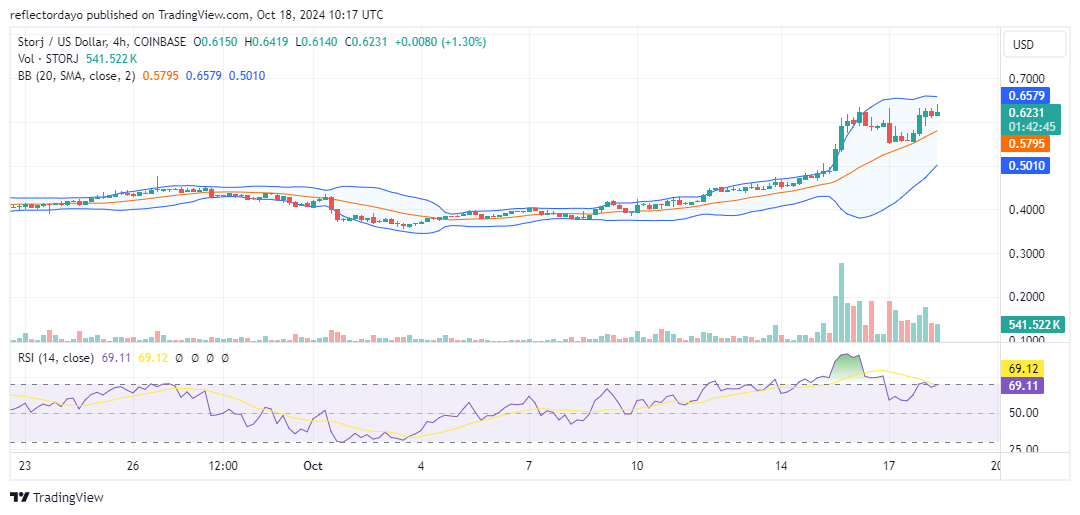
Zooming in to the 4-hour chart, we see the market struggling to hold the $0.60 price level. Bulls appear to be attempting to defend this level and the $0.55 mark, demonstrating resilience in the market.
If buyers continue to defend these levels, a period of consolidation may persist. However, if bullish momentum remains intact, the market’s next move is likely to be upward.