Lucky Block Price Prediction: LBLOCK/USD Gains Momentum Below $0.000210; Get Ready to Buy!
Estimated Reading Time: 3 minutes
Don’t invest unless you’re prepared to lose all the money you invest. This is a high-risk investment and you are unlikely to be protected if something goes wrong. Take 2 minutes to learn more
Lucky Block Price Prediction – December 18
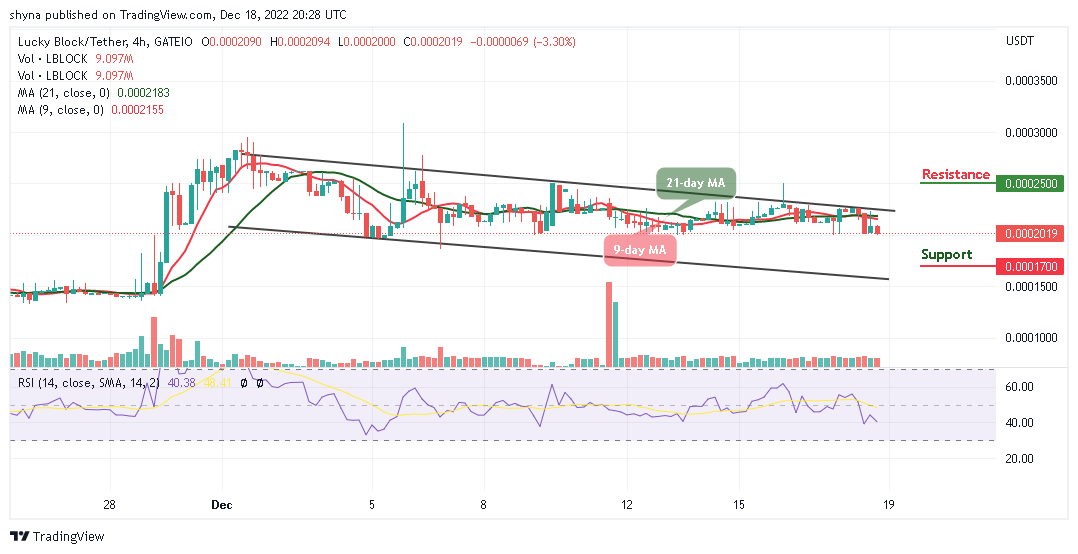
The Lucky Block price prediction shows that LBLOCK stays below the 9-day and 21-day moving averages as the price becomes low.
LBLOCK/USD Medium-term Trend: Ranging (4H Chart)
Key Levels:
Resistance levels: $0.00025, $0.00027, $0.00029
Support levels: $0.00017, $0.00015, $0.00013
LBLOCK/USD is preparing for the next upsurge as the coin trades around $0.000201. The coin will begin to trade bullishly as the bulls get ready for the upside. It is likely for the coin to touch the $0.000200 support before heading to the north. This is necessary for LBLOCK/USD to reach higher resistance levels as the existing buyers are expected to buy the dip.
Lucky Block Price Prediction: LBLOCK/USD Could Face a Retracement
The Lucky Block price consolidates below the 9-day and 21-day moving averages and this could be the time for the buyers to buy the dip as the coin retreats a little. Moreover, the technical indicator Relative Strength Index (14) is moving to cross below the 40-level and any bearish movement below the lower boundary of the channel could find support at $0.000170, $0.000150, and $0.000130.
However, if the buyers hold the current market value and push it to cross above moving averages, the bulls can expect a break towards the upper boundary of the channel, any further bullish movement could hit the resistance levels at $0.000250, $0.000270, and $0.000290.
LBLOCK/USD Medium-term Trend: Ranging (2H Chart)
On the 2-hour chart, the Lucky Block (LBLOCK) is hovering below the 9-day and 21-day moving averages as the coin touches the low at $0.000201, which becomes a good time for the new and existing buyers to invest more.

Nevertheless, buyers are gaining momentum as they are ready to push the coin towards the north; meanwhile, higher resistance could be located towards the upper boundary of the channel at $0.000220 and above. Therefore, any bearish movement below the lower boundary of the channel could hit the support level at $0.000190 and below while the technical indicator Relative Strength Index (14) moves in the same direction below 40-level, suggesting a sideways movement.
You can purchase Lucky Block here. Buy LBLOCK