Wall Street Memes (WSM) Trade Hovers, Reshaping Spirals
Estimated Reading Time: 3 minutes
Don’t invest unless you’re prepared to lose all the money you invest. This is a high-risk investment and you are unlikely to be protected if something goes wrong. Take 2 minutes to learn more

Wall Street Memes Price Prediction – February 5
Most pushes between bulls and bears in the transactions of Wall Street Memes against the material worth of the US currency have been featuring between the lower channels of the Bollinger Bands, given that the crypto-economic trade now hovers, reshaping spirals in inputs.
The recent price movements toward the lower Bollinger Band have created favorable conditions for potential long entries. As this accumulation phase continues, buyers should remain cautious of potential pullbacks that could occur alongside the upward momentum.
WSM/USD Market
Key Levels
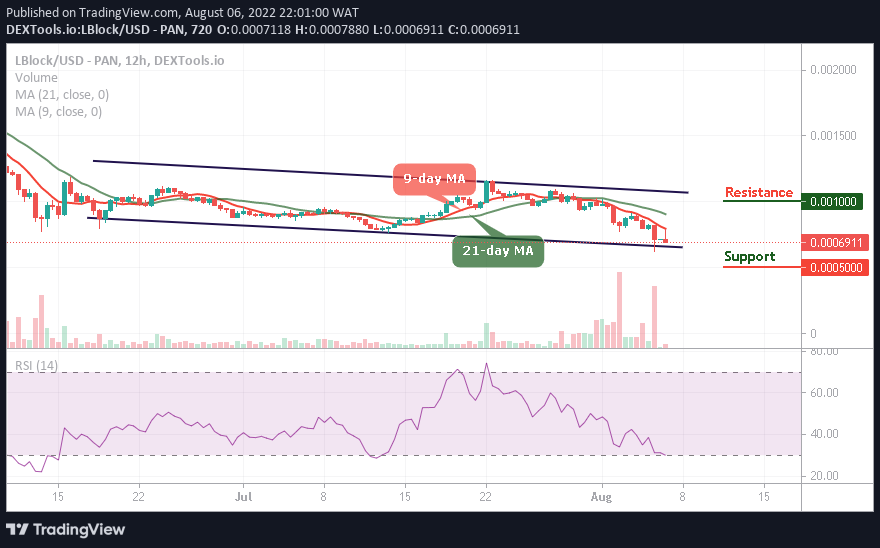
Resistance levels: $0.001, $0.0015, $0.002
Support levels: $0.0005, $0.0004, $0.0003
WSM/USD – 4-hour Chart
The WSM/USD market 4-hour chart depictures that the crypto-economic trade presently hovers, reshaping spirals in the method of generating signals.
The current Bollinger Bands setup indicates that the market is likely to experience a period of recovery near the lower boundary of the bands. Meanwhile, the stochastic oscillators have been fluctuating around the 80 level, maintaining a slightly upward bias.
Should traders think about sell-off orders for a bit, as the WSM/USD market appears to be less active right now?
If the WSM/USD market bears continue to place priority above any other trade sentiments at this point, it could lead to a whipsawed condition, as the base instrument hovers—reshaping spirals in inputs versus the purchasing weight of the American currency.
The Bollinger Bands’ placement pattern, which is primarily within or between the $0.001 and $0.00055 value lines, suggests that buyers should plan their long entrance around those prices. A weak fear might be triggered by a rapid coupling with a price reversal in the indicators’ upper zone. However, in order to advance in the process, traders need to continue to add more position orders.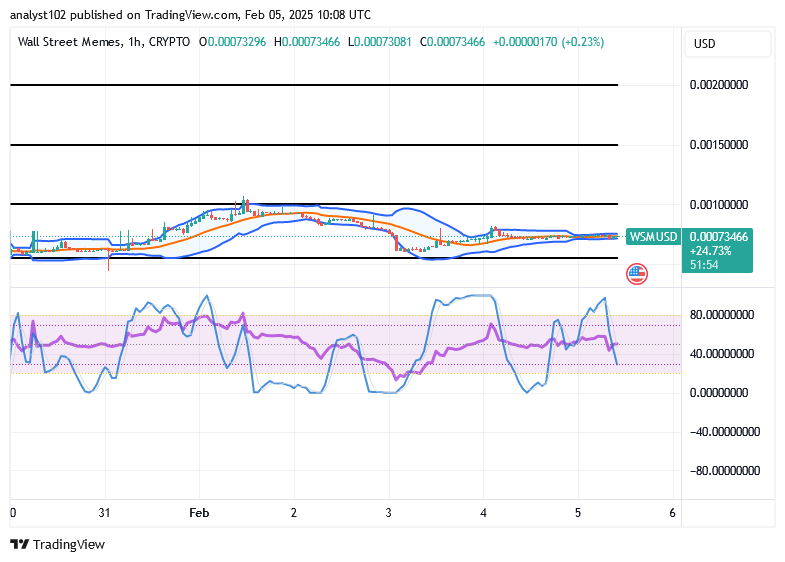
WSM/USD 1-hour chart
The 1-hour chart showcases that the WSM/USD trade hovers, reshaping spirals in inputs at the top side of the underlying support of $0.00055.
The way of featuring of the candlesticks has been characterized by lower highs than lower lows in the shape of maintaining a slanting method. The Bollinger Bands indicators have turned southbound close to the line of 20. Expectedly, there will soon be a rejuvenation of momentum at a contending lower basis ahead of possible rebounds.
There will be indicators, but I won’t inform anyone when I’ve made it.
I wont tell anyone when I’ve made it but there will be signs pic.twitter.com/6eaMkcHwo2
— Wall Street Memes (@wallstmemes) February 5, 2025
Buy and stake WSM now!: Wall Street Meme (WSM)