Lucky Block Price, July 17 – Breakout Imminent as Technical Signals Align
Estimated Reading Time: 3 minutes
Don’t invest unless you’re prepared to lose all the money you invest. This is a high-risk investment and you are unlikely to be protected if something goes wrong. Take 2 minutes to learn more

Lucky Block (LBLOCK) continues to hold the attention of optimistic investors, showing steady resilience even as broader markets waver. Currently trading at $0.00004022, LBLOCK is holding strong near key support levels, and both the daily and 4-hour charts reveal signals that point toward a promising upside. With clear signs of a shift in momentum, LBLOCK appears ready to ignite a new bullish leg.
Daily Chart: Steady Foundation for Growth
LBLOCK’s daily chart highlights a firm base for a potential upward push. The Parabolic SAR dots have flipped below the price and are staying consistent around the $0.00004003 zone, which reflects growing support. This technical setup suggests that downward pressure is easing and that bulls are gaining control.
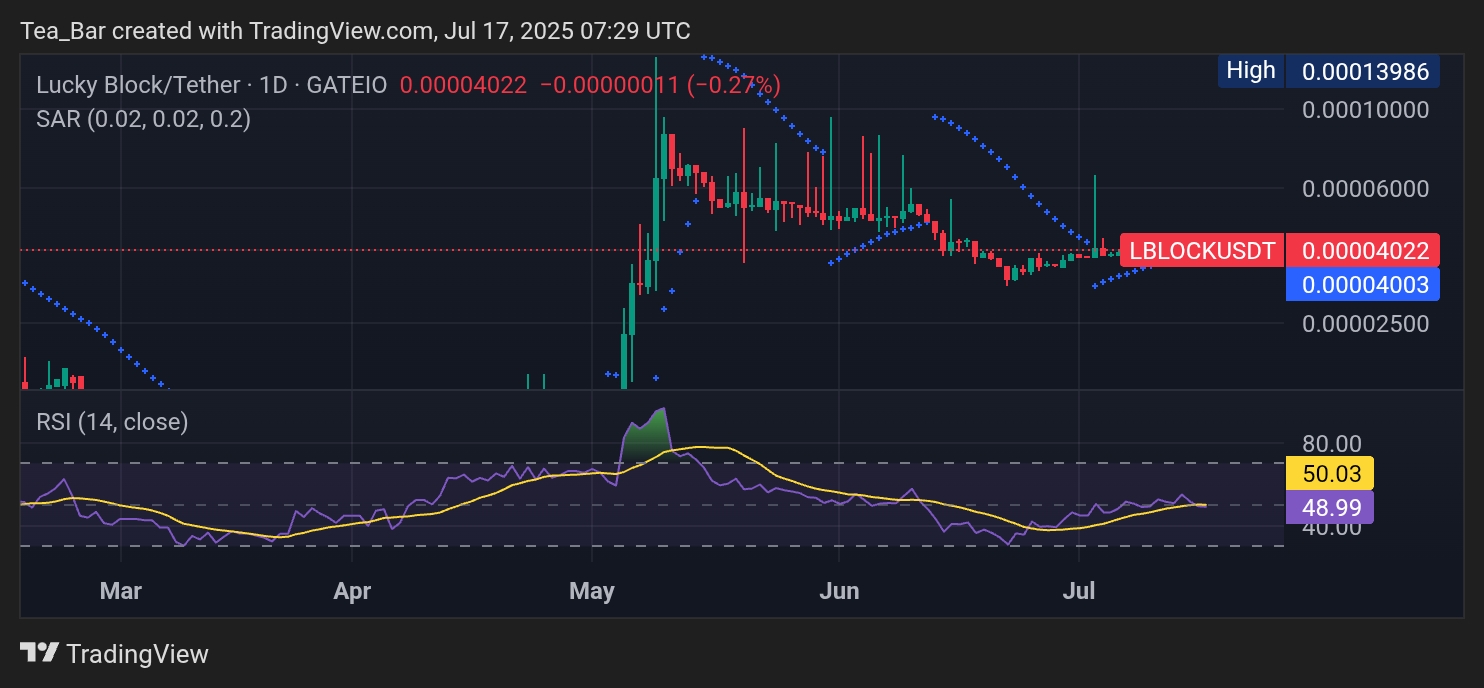
Meanwhile, the RSI has made a confident rebound and currently hovers around 49, edging toward neutral territory. This signals that the token still has ample room to rise before approaching overbought levels, making a strong upward move likely if buying interest increases.
The long-term view remains encouraging, especially considering that LBLOCK has already delivered a notable rally earlier this year. The current consolidation pattern is forming a solid base that could lead to the next big breakout.
4-Hour Chart: Momentum Building Quietly
Zooming into the 4-hour chart, LBLOCK is showcasing signs of stability and potential energy for a short-term surge. The RSI sits at 42.22 and is stabilizing, leaving plenty of upside space for bulls to stretch their legs. The recent movement indicates buyers are cautiously returning, and any price push above $0.00004264 may unlock a bullish rally.
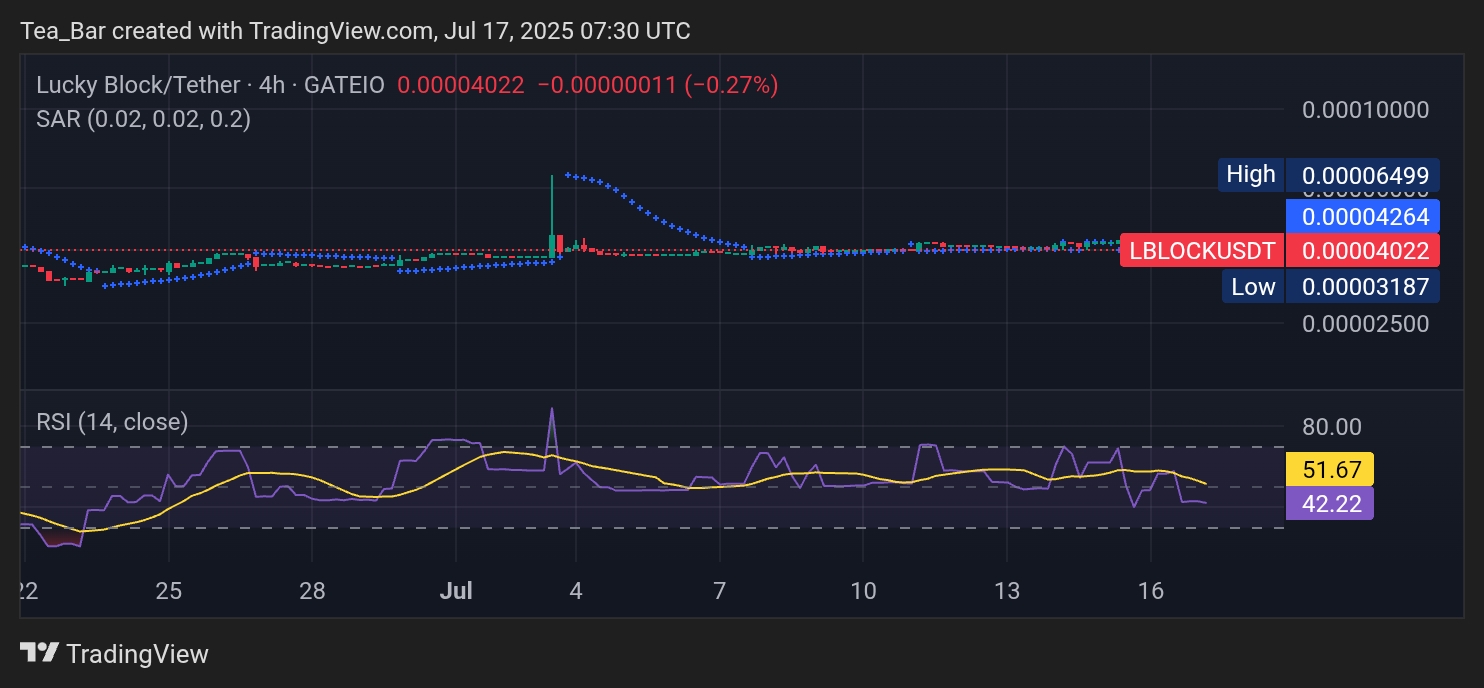
Parabolic SAR dots remain just above the current price but are narrowing, suggesting that a flip may be near. Once those dots shift below the candlesticks, it could signal a fresh bullish trend forming in the short term.
Conclusion: LBLOCK Looks Ready to Advance
Lucky Block is painting a compelling technical picture. Both the daily and 4-hour charts indicate a maturing bullish setup, with firm support zones, favorable RSI levels, and a possible SAR confirmation on the horizon. While the token is still in a coiled position, any breakout above key resistance levels could send LBLOCK flying toward new short-term highs. For traders watching closely, this could be the calm before a bright move upward.
Invest wisely, and let Lucky Block’s potential work in your favor. You can purchase Lucky Block here. Buy LBLOCK.