Swell Market (SWELL/USD) Update: Bullish Bias Reemerges as Price Surges
Estimated Reading Time: 3 minutes
Don’t invest unless you’re prepared to lose all the money you invest. This is a high-risk investment and you are unlikely to be protected if something goes wrong. Take 2 minutes to learn more

A renewed bullish bias has emerged in today’s trading session, marking a clear shift from the previously bearish trend. The price of the Swell market rebounded from the $0.008 level and surged to a high of approximately $0.013 before settling around the key $0.010 threshold.
This notable upward movement signals a potential shift into bullish territory, provided the bulls can maintain support at the $0.010 level. Sustained buying pressure at this price point could further solidify the bullish outlook and set the stage for continued upward momentum.
The Swell Market (SWELL/USD) Market Data
- SWELL/USD Price Now: $0.0104
- SWELL/USD Market Cap: $27 million
- SWELL/USD Circulating Supply: 2.6 billion SWELL
- SWELL/USD Total Supply: 10 billion SWELL
- SWELL/USD CoinMarketCap Ranking: #768
Key Levels
- Resistance: $0.011, $0.012, and $0.013
- Support: $0.0095, $0.008, and $0.007
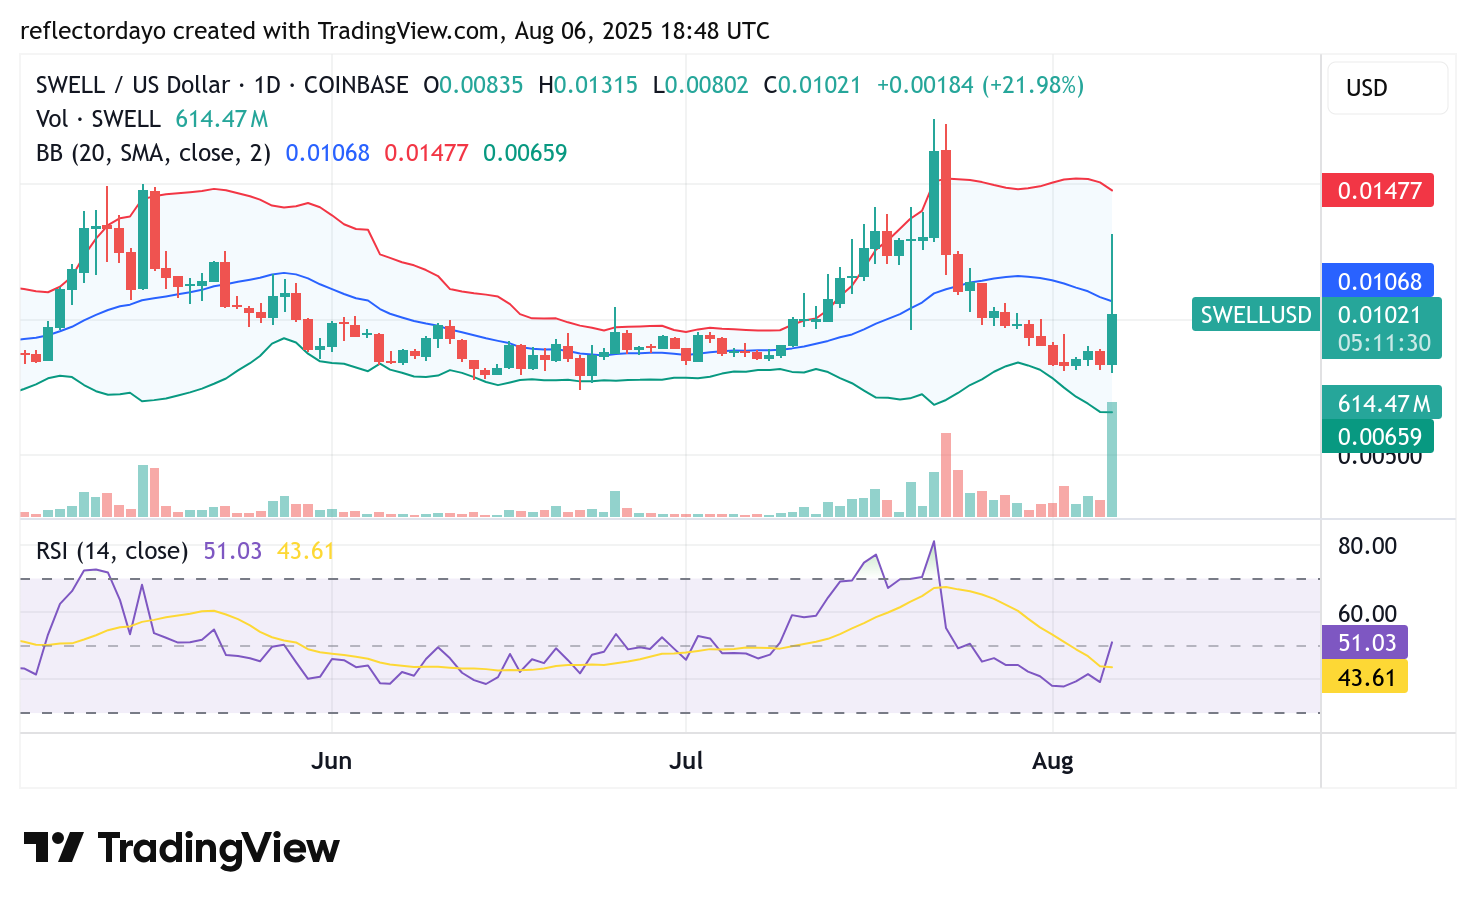
Swell (SWELL/USD) Technical Outlook: Bulls Regain Ground Amid Persistent Volatility
Recently, a bearish breakout around the $0.017 level triggered a surge in market volatility, which bears quickly capitalized on, driving the price sharply downward. Within a short span, the Swell market (SWELL/USD) plunged into lower price zones.
As the market approached the $0.010 level, bearish momentum showed signs of slowing, with some traders beginning to position for a potential reversal. However, the downtrend persisted until the price reached the $0.008 threshold—where a solid support base finally emerged. This level served as a turning point, allowing bulls to initiate a recovery and push the price back above the critical $0.010 mark.
Despite this bullish rebound, the Bollinger Bands indicate continued high volatility. Currently, traders are closely monitoring the $0.010 level. Whether the market maintains its upward trajectory, enters a consolidation phase, or reverses again will largely depend on how price action unfolds around this key support/resistance zone.
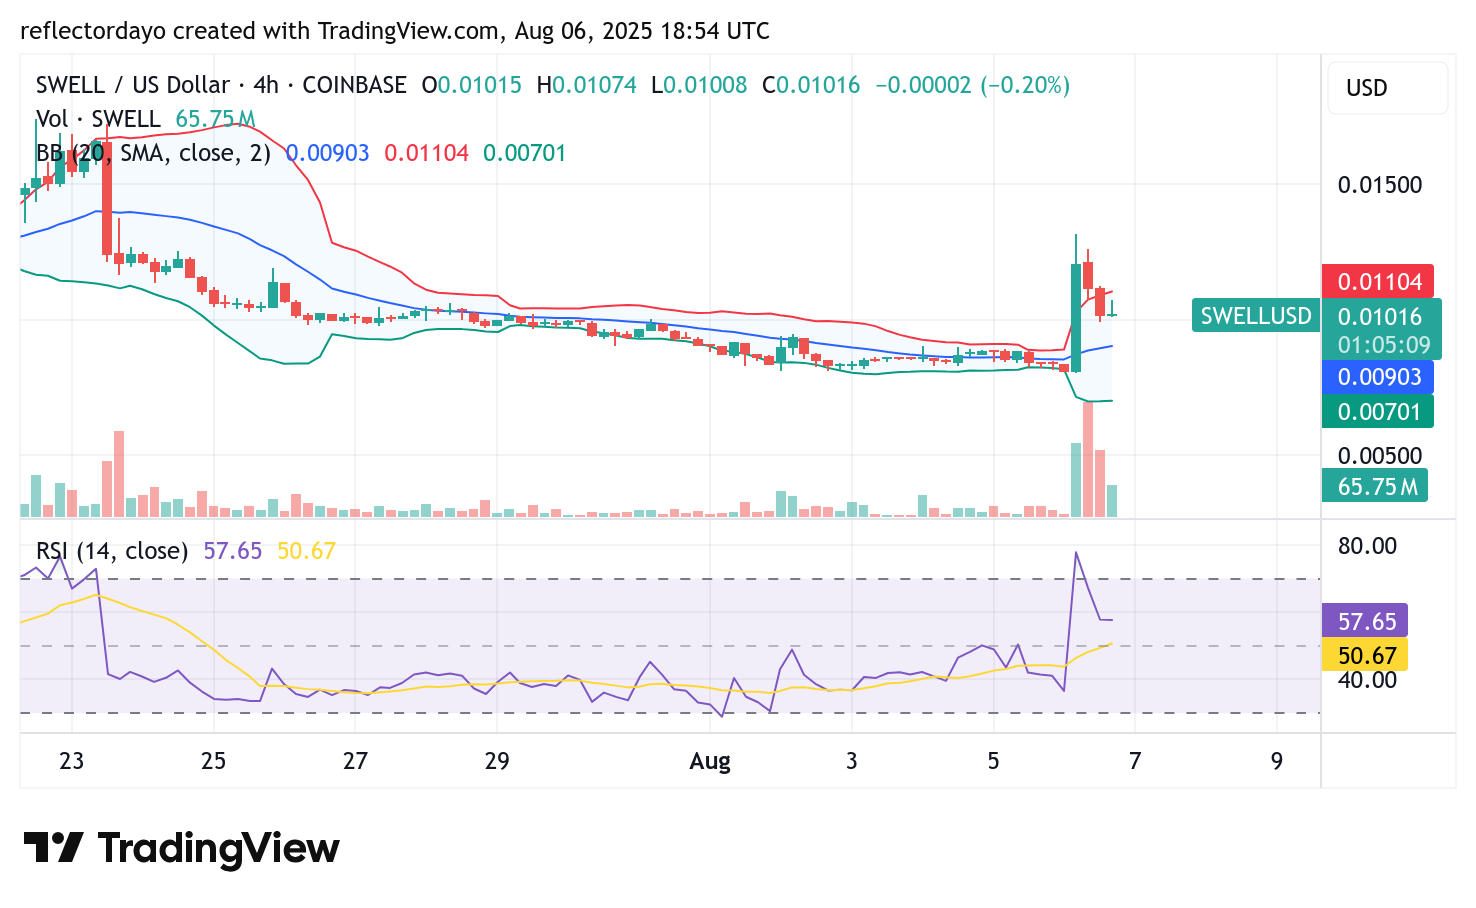
SWELL/USD 4-Hour Chart: Bullish Momentum Faces Key Test at $0.010 Support
Zooming into the 4-hour chart provides a clearer view of the recent market dynamics. The bullish price movement observed earlier in the day was notably strong—almost hyper-bullish—pushing the Swell market swiftly into overbought territory.
As is often the case, such aggressive upward moves can be followed by sharp corrections. However, traders are likely to pay close attention to key price levels, particularly the $0.010 mark. This level may act as a decisive point of indecision, where market participants reassess momentum.
If $0.010 holds as support, it could be established as a solid higher low—strengthening the bullish case and potentially keeping the market on an upward trajectory.