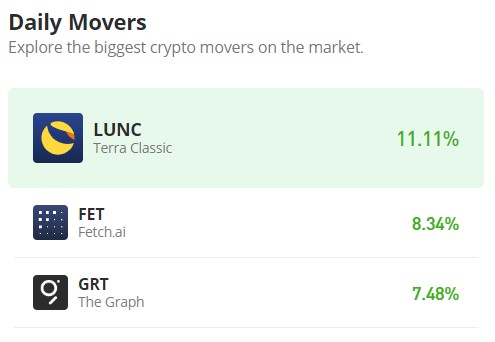
Biconomy (BICO/USD) Bulls Defend Bullish Trend at the $0.100 Level
Estimated Reading Time: 3 minutes
Don’t invest unless you’re prepared to lose all the money you invest. This is a high-risk investment and you are unlikely to be protected if something goes wrong. Take 2 minutes to learn more

Biconomy has been on a bullish recovery path since late June. However, heightened market volatility allowed bearish pressure to briefly slow the upward momentum. The asset has experienced significant price swings between highs and lows, reflecting the unstable trading environment. Despite these fluctuations, bulls have managed to maintain control, preserving the broader bullish trend and defending the key $0.100 support level.
Biconomy (BICO/USD) Market Data
- BICO/USD Price Now: $0.108
- BICO/USD Market Cap: $104 million
- BICO/USD Circulating Supply: 971 million BICO
- BICO/USD Total Supply: 1 billion
- BICO/USD CoinMarketCap Ranking: #343
Key Levels
- Resistance: $0.11, $0.12, and $0.13
- Support: $0.095, $0.090, and $0.085
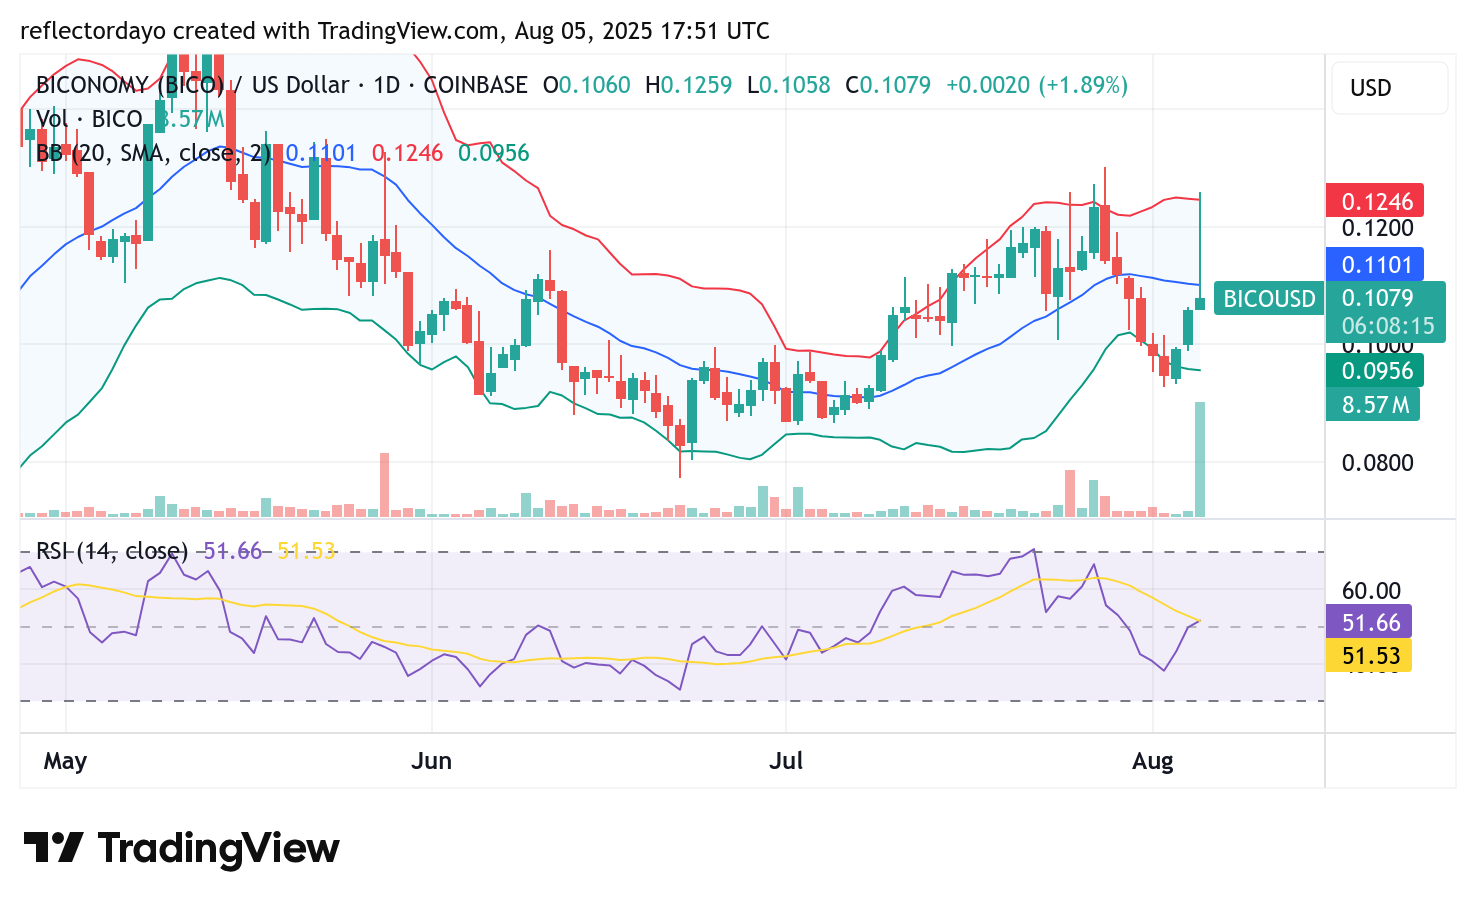
Biconomy (BICO/USD) Technical Outlook: Bulls Struggle to Reclaim Key Support at $0.1085
Biconomy’s bullish recovery remains under pressure as the price action breached the critical $0.1085 support level amid heightened market volatility. The breakdown was short-lived, as the market quickly dipped toward the $0.095 zone—another key support—where bullish sentiment re-emerged.
In today’s trading session, buyers attempted to redirect momentum back toward the $0.1085 level in an effort to reclaim it as support. While the price briefly rebounded from the $0.10 region and surged to a high of approximately $0.1246, it was quickly rejected, with price action falling once again below the $0.1085 threshold.
This intraday movement created a long upper shadow on the candlestick, a potentially bearish crypto signal that suggests sellers may be regaining control. A decisive rebound is still possible, but the failed attempt to reclaim $0.1085 raises caution about the sustainability of the bullish trend.
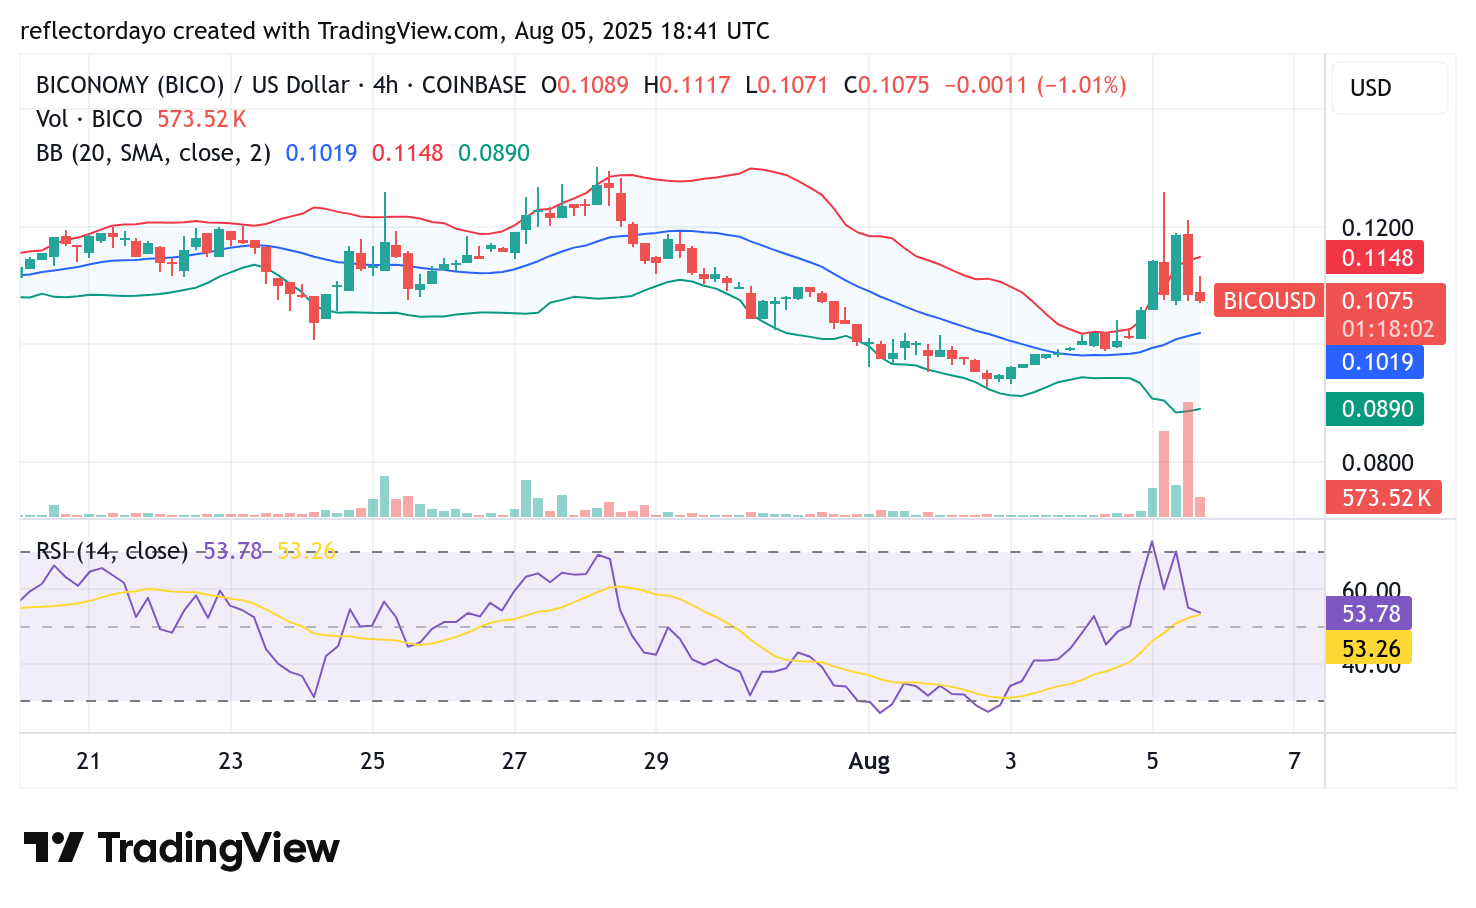
BICO/USD 4-Hour Chart: Bulls Establish Stronghold Around $0.108 as Volatility Declines
Despite lingering fears that the price may dip below the critical $0.100 level, the 4-hour chart reveals that bulls are working diligently to sustain the ongoing bullish recovery near the $0.108 support zone. Although the market still displays notable volatility on this timeframe, the bulls have repeatedly fended off bearish pressure at this level—reinforcing it as a formidable support zone.
Encouragingly, the trading volume indicator now shows a gradual decline in volatility, suggesting that the market may be stabilizing. If the $0.108 support continues to hold, it could serve as a strong launching point for the next leg of the recovery.