Lucky Block Price Prediction: LBLOCK/USD is Extremely Cheap; Best Opportunity for Buyers
Estimated Reading Time: 3 minutes
Don’t invest unless you’re prepared to lose all the money you invest. This is a high-risk investment and you are unlikely to be protected if something goes wrong. Take 2 minutes to learn more
Lucky Block Price Prediction – March 15
The Lucky Block price prediction nosedives below the moving averages as more buyers are expected to come into the market soon.
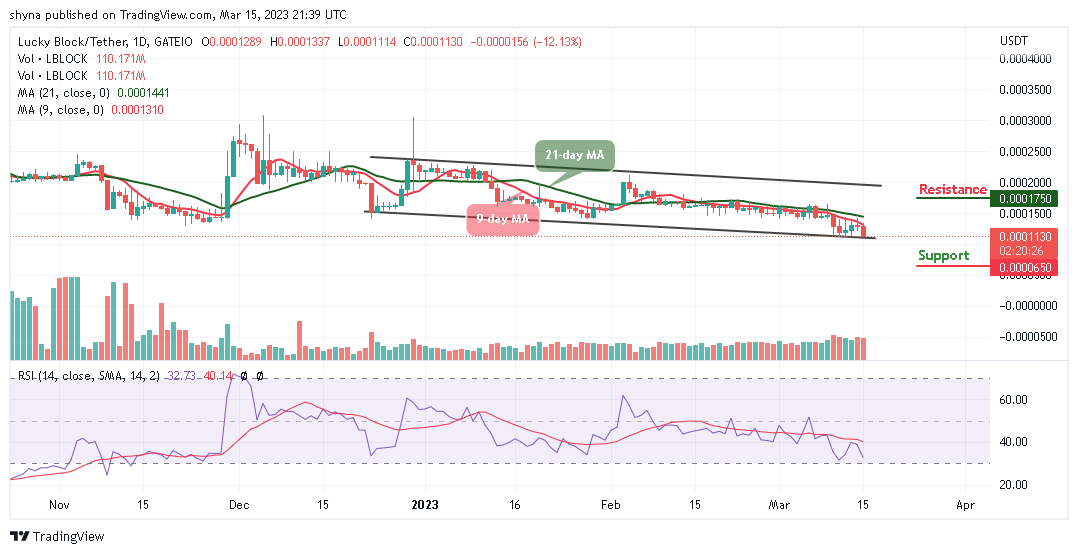
LBLOCK/USD Medium-term Trend: Ranging (1D Chart)
Key Levels:
Resistance levels: $0.000175, $0.000185, $0.000195
Support levels: $0.000065, $0.000055, $0.000045
At the time of writing, LBLOCK/USD is trading under the 9-day and 21-day moving averages, this is for the market price to prepare for another bullish movement. However, the buyers could be gathering enough momentum so that new investors can come into the market.
Lucky Block Price Prediction: LBLOCK/USD Will Pump Up Furiously
The Lucky Block price could touch the support level of $0.000110 before heading to the upside. However, as soon as the 9-day moving average crosses above the 21-day moving average, the Lucky Block price will begin the upward movement. Therefore, any further bullish movement above could hit the resistance levels of $0.000175, $0.000185, and $0.000195.
Meanwhile, the market can become very cheap if the coin crosses below the lower boundary of the channel, once this comes to focus, LBLOCK/USD can hit the supports at $0.000065, $0.000055, and $0.000045. At the moment, the technical indicator Relative Strength Index (14) is moving to cross into the oversold region to increase the bearish movement. Hence, the buyers should use this opportunity to invest more in the coin.
LBLOCK/USD Medium-term Trend: Bearish (4H Chart)
On the 4-hour chart, the Lucky Block price is also seen hovering below the 9-day and 21-day moving averages. Meanwhile, if the buyers can hold the current market value and push the coin up, the market could start a new trend in the next positive direction. Moreover, as soon as the Lucky Block price heads to the upside, a higher resistance level could be located at $0.000150 and above.
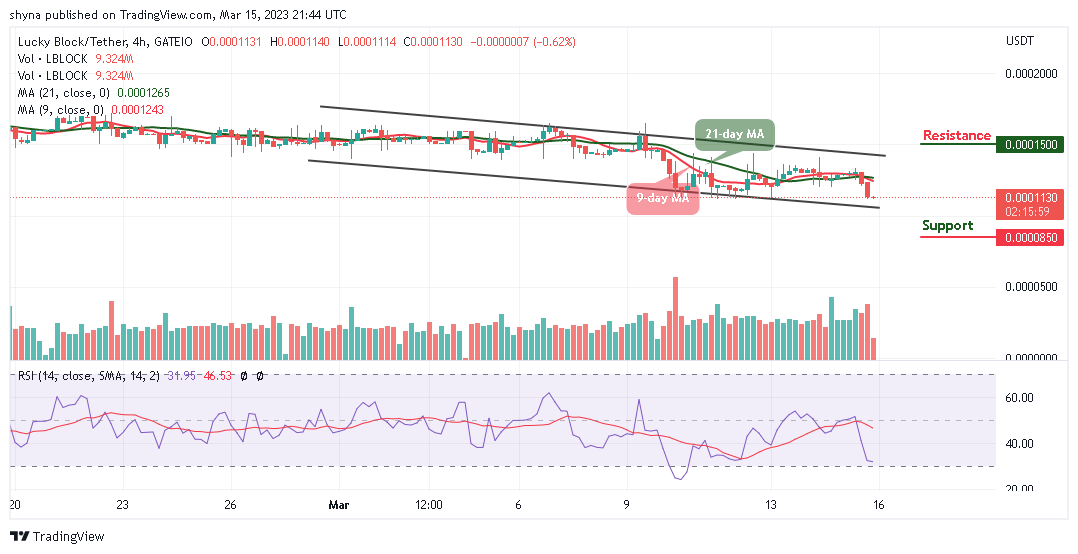
Meanwhile, the technical indicator Relative Strength Index (14) is moving below the 35-level, indicating that the coin could touch the support of $0.000110 before facing the north. Therefore, should bulls fail to move the coin higher; sellers could bring it to the support level of $0.000085 and below.
You can purchase Lucky Block here. Buy LBLOCK