Litecoin (LTC) Price Prediction: LTC/USDT Surges
Estimated Reading Time: 3 minutes
Don’t invest unless you’re prepared to lose all the money you invest. This is a high-risk investment and you are unlikely to be protected if something goes wrong. Take 2 minutes to learn more

Litecoin (LTC) Price Prediction: February 10
The LTC daily market has been experiencing steady gains in bullish momentum over the previous sessions. However, today the market has seen a stronger price pump, with the token’s price resurfacing above the $120 price level. Consequently, this gives the market a healthy look.
LTC/USDT Long-Term Trend: Bullish (Daily Chart)
Key Price Levels:
Resistance: $125, $130, $135
Support: $120, $115, $110
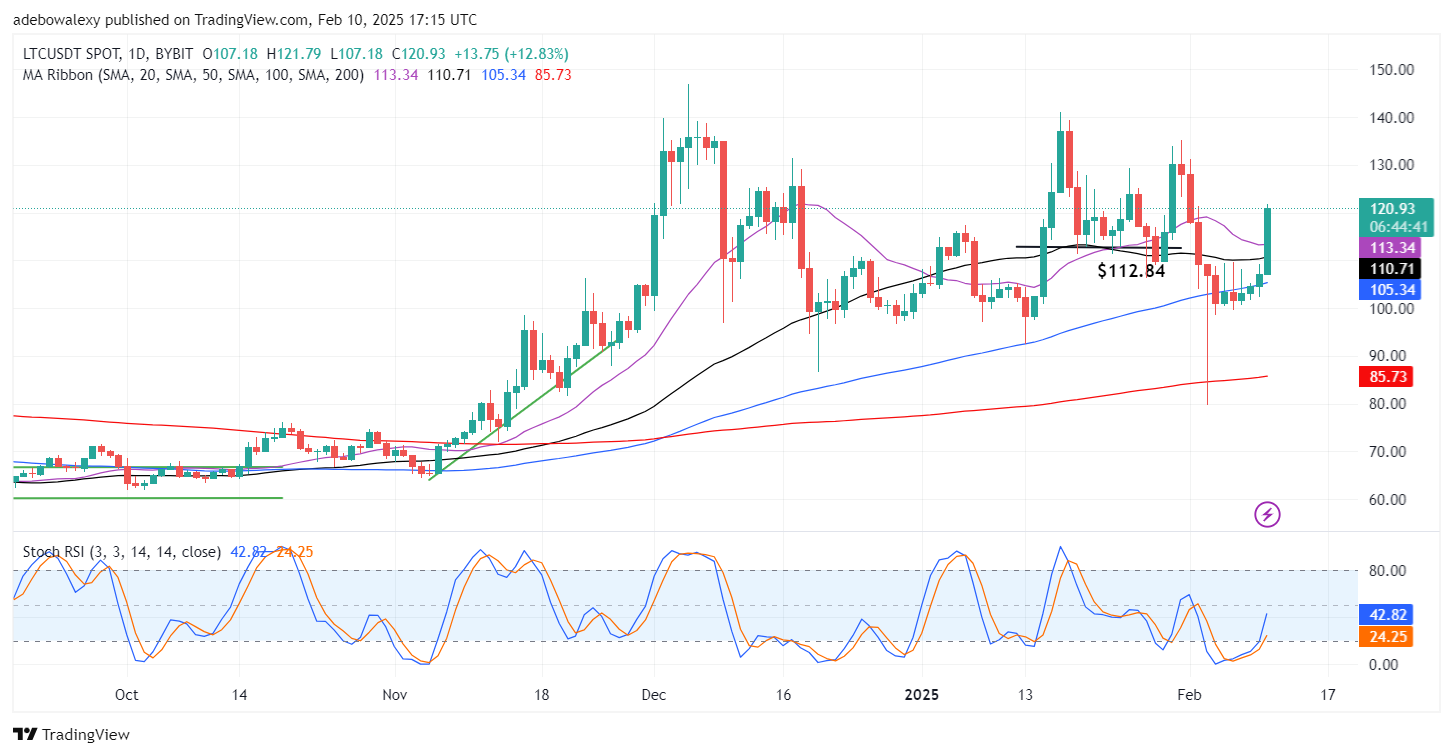
While this market has been generally retracing higher grounds over the past three sessions, the ongoing session has been particularly notable. This is portrayed by the size of the corresponding price candle. As a result, Litecoin now trades above all the Moving Average (MA) lines on the chart. The Stochastic Relative Strength Index (RSI) lines are rising upwards from the oversold region.
Litecoin (LTC) Price Prediction: LTC/USDT Sees a Strong Upside Move
The movement of the Stochastic RSI lines rising upwards suggests a significant gain in bullish pressure. This aligns with the appearance of the last price candle on the Litecoin chart, seeing that it is a long green price candle. This has placed the price of the token above all the MA lines.
Consequently, this suggests that this market may go higher from this point on. The mentioned price candle can be seen to have surpassed the $120 threshold level. However, traders should note that price action hasn’t found support above this region and, as such, hints at vulnerability.
Litecoin (LTC) Price Prediction: Bulls Are on a Winning Streak (4-Hour Chart)
Price action on the Litecoin 4-hour market has been rising steadily through multiple resistance levels. The last price candle on this chart remains bullish and has appeared above all the MA lines on the chart. Likewise, the 100- and 200-day MA lines can be seen converging for a crossover below the last price candle on the chart. This hints that upside momentum may gain strength.
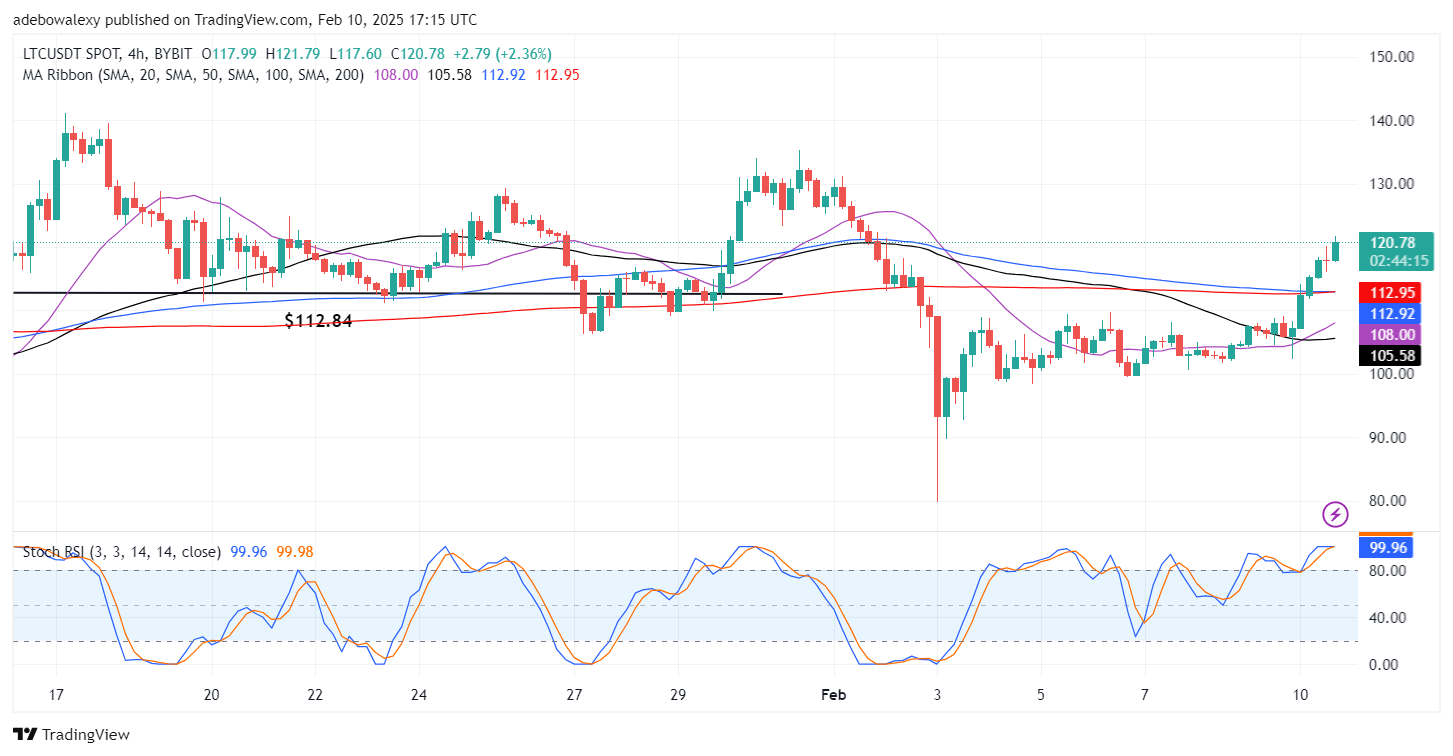
Meanwhile, the Stochastic RSI lines are trending sideways at roughly the 100 mark of the indicator. Technically, it seems more likely that the upside momentum in this market may persist. The behavior of the RSI lines coincides with the convergence of the 100- and 200-day MA lines. Therefore, traders can still aim at the $125 mark as a target.