Dogecoin (DOGE) Price Prediction: Dogecoin Sustains Above the 200-Day MA as Volatility Dwindles
Estimated Reading Time: 3 minutes
Don’t invest unless you’re prepared to lose all the money you invest. This is a high-risk investment and you are unlikely to be protected if something goes wrong. Take 2 minutes to learn more

Dogecoin (DOGE) Price Prediction: February 9
The Dogecoin market has significantly dipped over the recent past. Price action in this market is currently just above another technical support. Nevertheless, recent price action suggests that upside forces are attempting to keep the market afloat here despite being under considerable downward pressure at this point.
DOGE/USDT Long-Term Trend: Bearish (Daily Chart)
Key Price Levels:
Resistance: $0.3000, $0.3500, $0.4000
Support: $0.2500, $0.2000, $0.1500
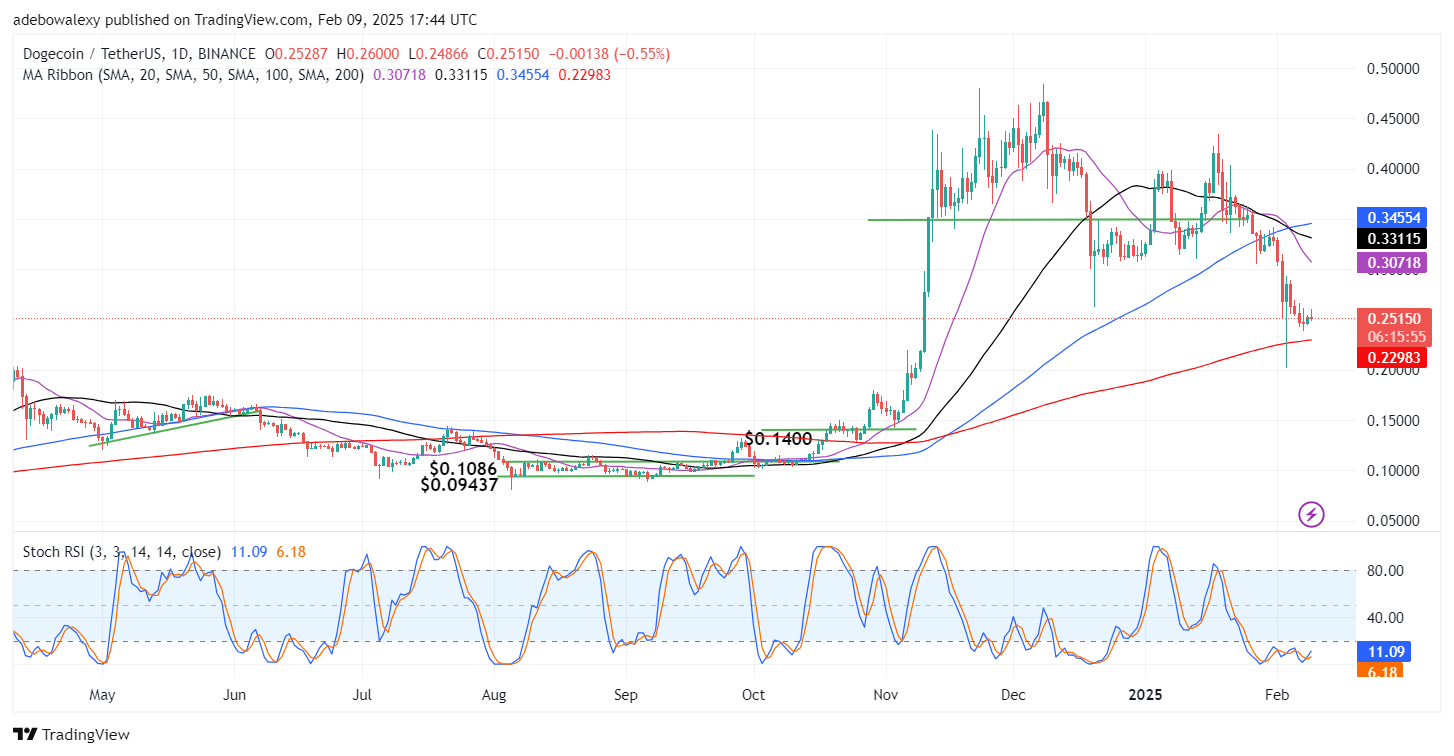
Price action has rebounded minimally in the previous session. However, the ongoing session can be seen to have presented a setback to that feat, seeing that it has appeared as a red price candle. Nevertheless, price action stands above the 200-day Moving Average (MA) lines. Meanwhile, the last Stochastic Relative Strength Index (RSI) lines can be seen still possessing an upward trajectory, following a crossover in that region of the indicator.
Dogecoin (DOGE) Price Prediction: DOGE/USDT Stays Under Tremendous Bearish Pressure
On the Dogecoin daily chart, it can be perceived that price action has fallen significantly. As a result, the token now trades just above the $0.2500 threshold after previously trading well above the $0.4500 price level. As a result, price action has fallen below three out of the four MA lines on the chart.
What’s more is that the three MA lines above price action are crossing each other, and as such, this is contributing to a significant bearish sentiment in this market. Meanwhile, seeing that the last price candle on this chart has placed the current price of the token above the most recent lows, the Stochastic RSI lines seem to still be responding to that fact. Consequently, this market still seems to be shaping for further price declines.
Dogecoin (DOGE) Price Prediction: Reduced Volatility Impedes Bearish Progress (4-Hour Chart)
Price action in the Dogecoin 4-hour market stays below most of the MA lines. In addition, price action seems to be hugging the 20-day MA lines as a support.
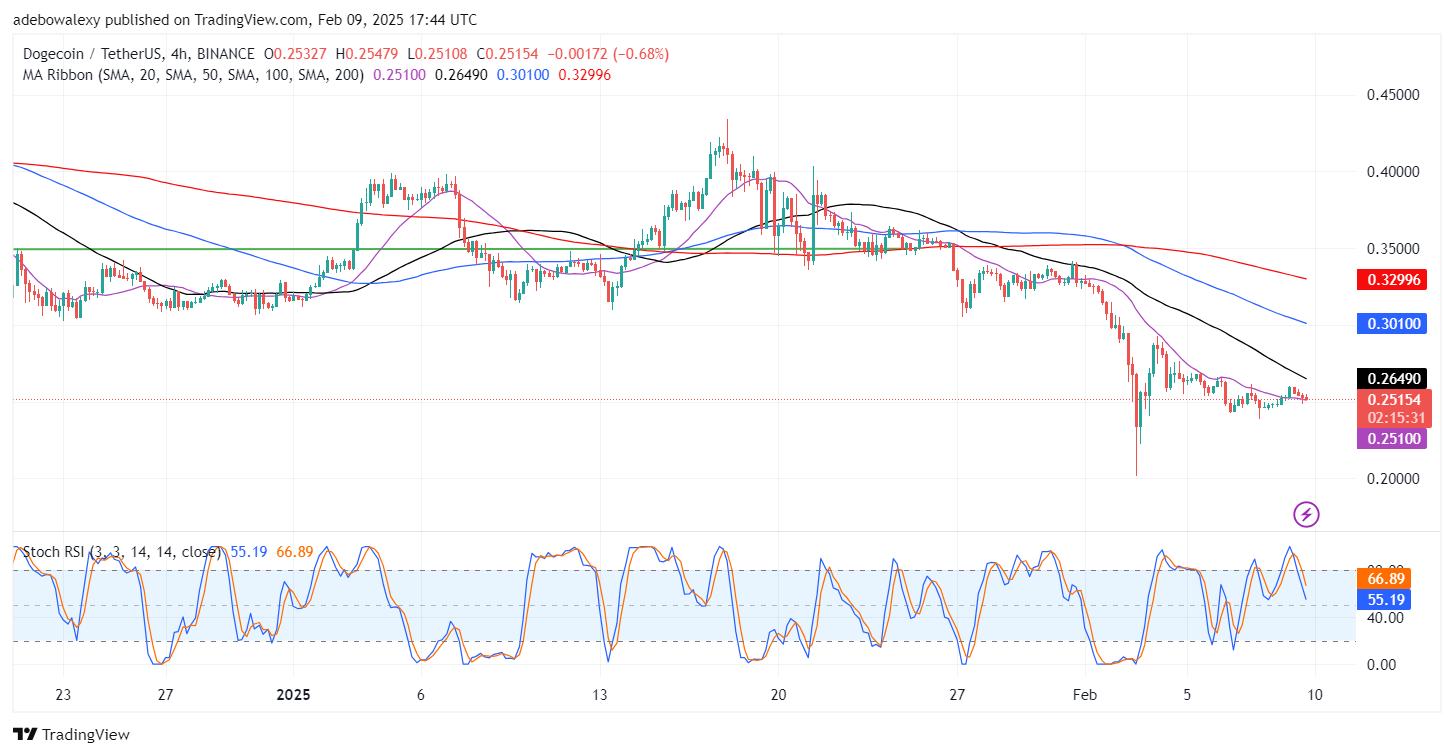
This is so despite the fact that bearish price candles have been appearing consistently over the past three sessions. Meanwhile, the Stochastic RSI lines can be seen progressing more rapidly than the price decline over the past three sessions.
Albeit, technical indicators here still suggest that the market is likely to progress downward, with the last price candle already testing the 20-day MA line for a break. However, reduced price volatility and the behavior of the Stochastic RSI lines hint that the price decline may not progress past the $0.2250 price level.