POL (ex-MATIC) Price Prediction: POL/USDT Hits Over Three-Month-Old Support
Estimated Reading Time: 3 minutes
Don’t invest unless you’re prepared to lose all the money you invest. This is a high-risk investment and you are unlikely to be protected if something goes wrong. Take 2 minutes to learn more

POL (ex-MATIC) Price Prediction: February 8
The POL (ex-MATIC) market has been steadily declining toward lower support levels for months. This downward trend began when price action broke through the $0.7000 resistance level. Ever since, the market has continued its descent.
POL/USDT Long-Term Trend: Bearish (Daily Chart)
Key Price Levels:
Resistance: $200, $210, $220
Support: $190, $180, $170
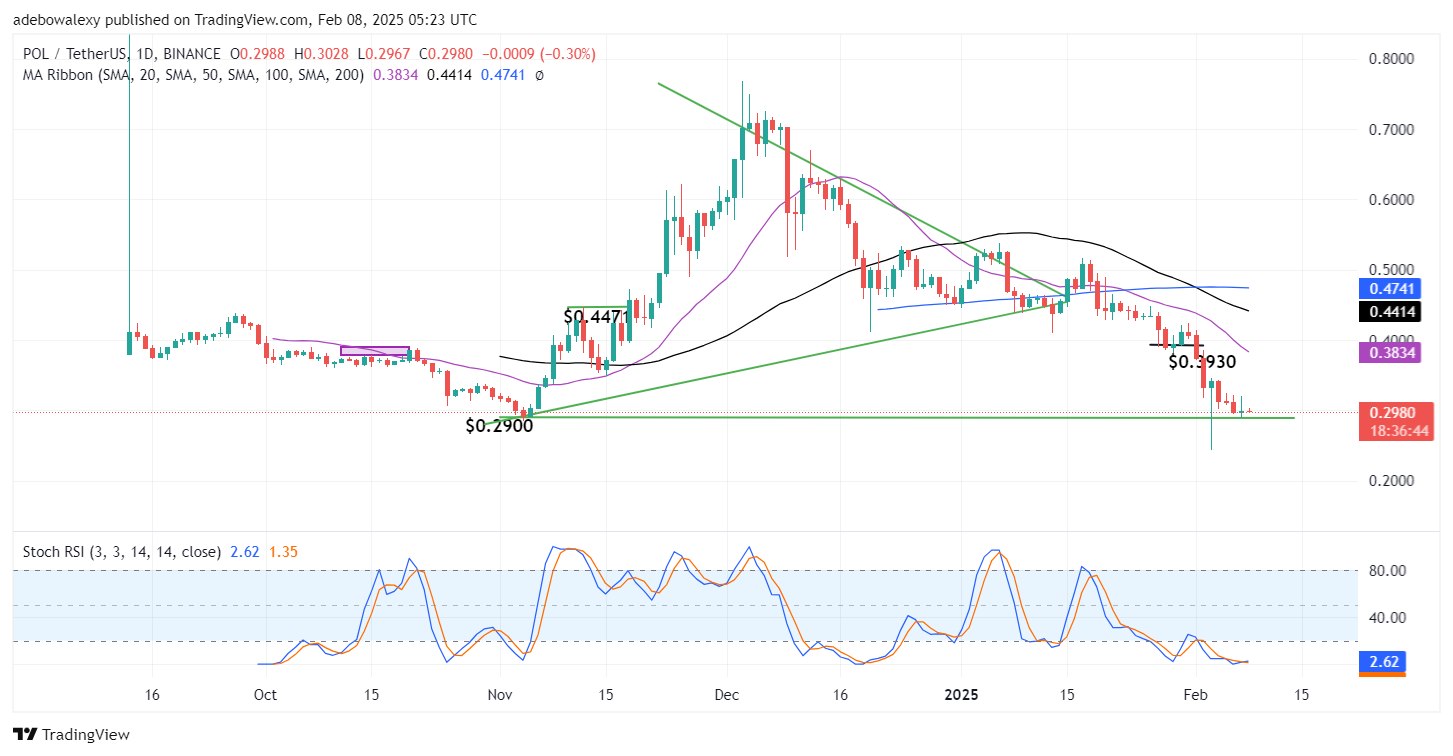
In the previous session, price action rebounded upward after testing support at the $0.2900 price mark. However, the market remains below all Moving Average (MA) lines. The price candles in both the ongoing and previous sessions are at the same level, indicating negligible price changes. Additionally, the Stochastic Relative Strength Index (RSI) lines have crossed each other but continue moving sideways, reflecting market indecision.
POL (ex-MATIC) Price Prediction: POL/USDT Remains Under Tremendous Pressure
Analyzing price action behavior, it is evident that the POL (ex-MATIC) market is experiencing strong bearish pressure. The last two price candles on the daily chart appear compressed and remain below all MA lines, confirming that bears maintain a firm grip on the market and control overall sentiment.
Furthermore, the Stochastic RSI lines continue trending sideways despite a crossover in the oversold region, reinforcing the presence of strong downward pressure. As a result, the ongoing bearish retracement may persist.
POL (ex-MATIC) Price Prediction: POL/USDT Bears Continue to Mount Pressure (4-Hour Chart)
Extending this price analysis to the 4-hour chart, we see that the POL (ex-MATIC) market remains under pressure and continues its downward trajectory. Price activity recently rebounded off the 20-day MA line as resistance, leading to a subsequent decline.
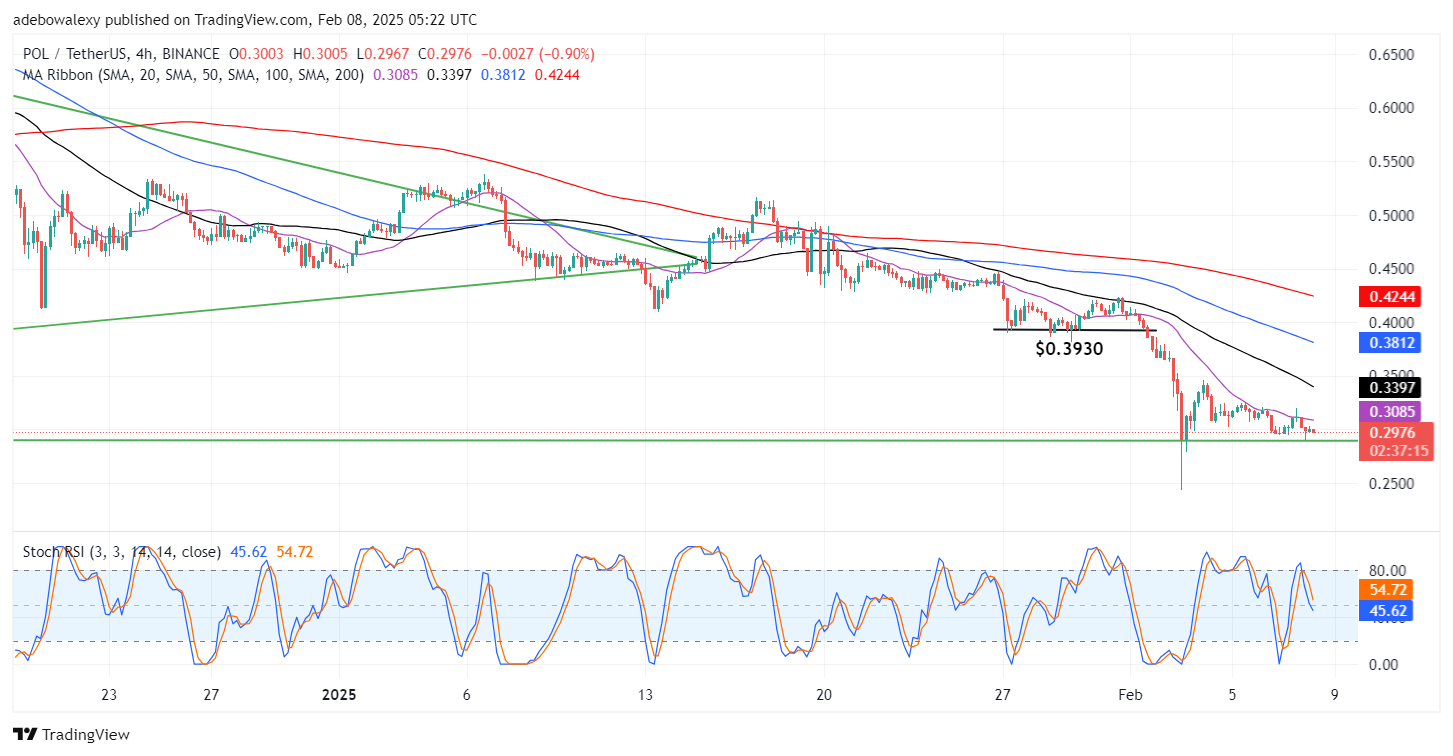
The latest red price candle has formed below all MA lines, reinforcing the bearish outlook. Meanwhile, the Stochastic RSI lines are falling toward the oversold region, further confirming downside potential.
From a technical perspective, market indicators suggest continued bearish movement. Price action remains below all MA lines, reinforcing a bearish sentiment. Additionally, the Stochastic RSI trajectory signals that price action is likely to extend its decline.
At the very least, traders can expect another test of the $0.2900 support level, with a high probability of breaching this support in the near term.