Ethereum Has Resumed Selling Pressure as the Altcoin Breaks $2,717 Low
Estimated Reading Time: 2 minutes
Don’t invest unless you’re prepared to lose all the money you invest. This is a high-risk investment and you are unlikely to be protected if something goes wrong. Take 2 minutes to learn more

Free Crypto Signals Channel

Ethereum Price Long-Term Analysis: Bearish
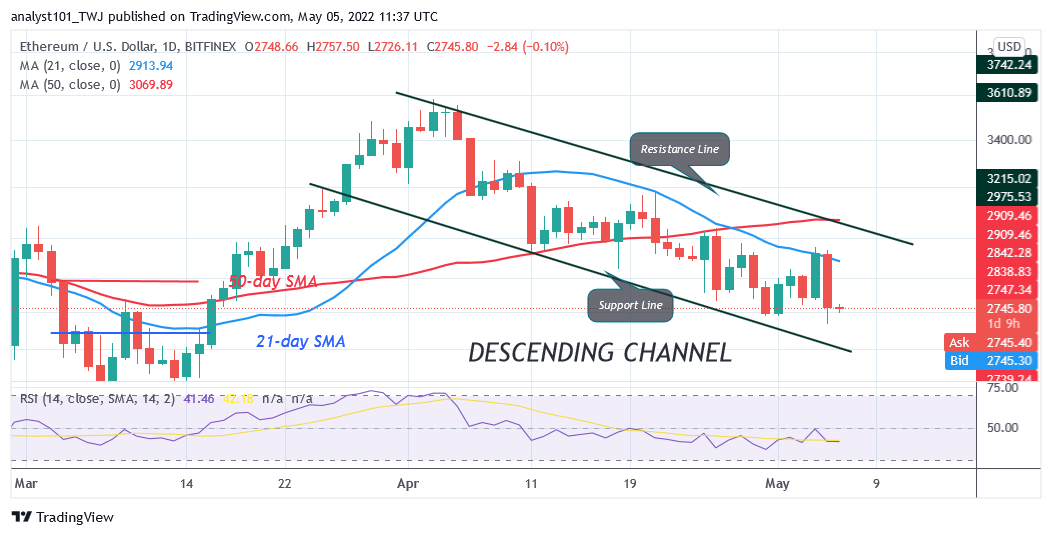
Ethereum’s (ETH) price is in a downward correction as the largest altcoin breaks $2,717 low. On May 4, the altcoin could not break above the resistance at $2,951. The $2,951 price level is the previous support of April 11 which is now a resistance. Buyers pushed the altcoin to the high of $2,965 and were repelled. On the upside, if the bulls were successful, ETH/USD would have rallied above the moving averages. At the same, Ether would have revisited the high of $3,200. Nonetheless, yesterday, the altcoin declined to the low of $2,688 and pulled back. Today, Ether has resumed selling pressure and may reach the previous low of $2,491.
Ethereum Indicator Analysis
Ether has fallen to level 41 of the Relative Strength Index for period 14. Ether is in the downtrend zone as the selling pressure resumes. Buyers could not sustain the altcoin above the $2,951 high. Ether has a bearish crossover. The 21-day line SMA crosses below the 50-day line SMA indicating a sell order. The altcoin is below 40% area of the daily stochastic. It is in a bearish momentum.
Technical indicators:
Major Resistance Levels – $2, 600, $2,800, $3,000
Major Support Levels – $1.500, $1, 300, $1,100
.
What Is the Next Direction for Ethereum
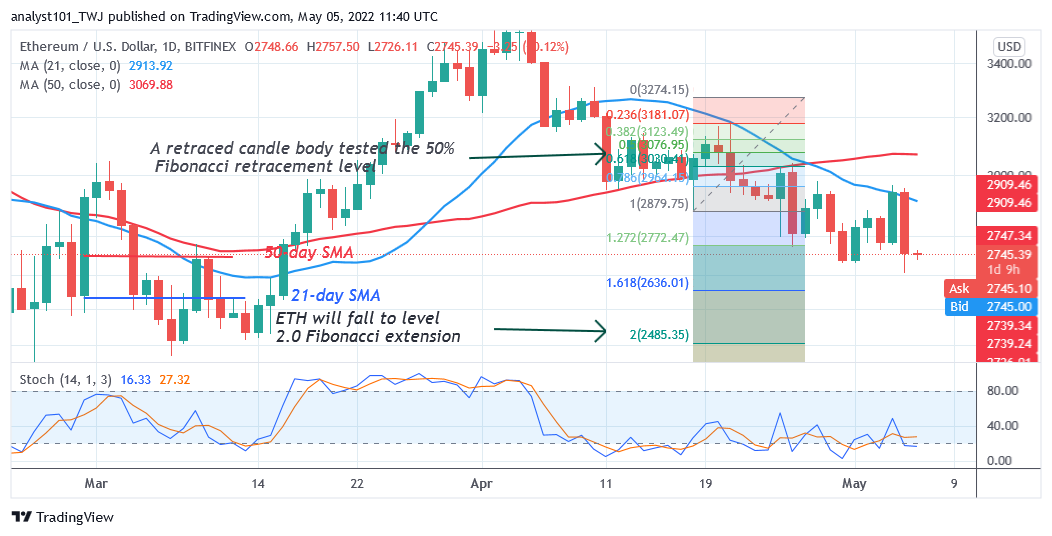
Ether is likely to resume selling pressure because the altcoin breaks $2,717 low. Meanwhile, on April 18 downtrend; a retraced candle body tested the 50% Fibonacci retracement level. The retracement indicates that ETH will fall to level 2.0 Fibonacci extension or $2,485.35.
You can crypto coins here. Buy LBlock
Note: Cryptosignals.org is not a financial advisor. Do your research before investing your funds in any financial asset or presented product or event. We are not responsible for your investing results

