Ethereum Loses $3,000 Support as It Risks a Possible Decline
Estimated Reading Time: 2 minutes
Don’t invest unless you’re prepared to lose all the money you invest. This is a high-risk investment and you are unlikely to be protected if something goes wrong. Take 2 minutes to learn more

Free Crypto Signals Channel

Ethereum Price Long-Term Analysis: Bearish
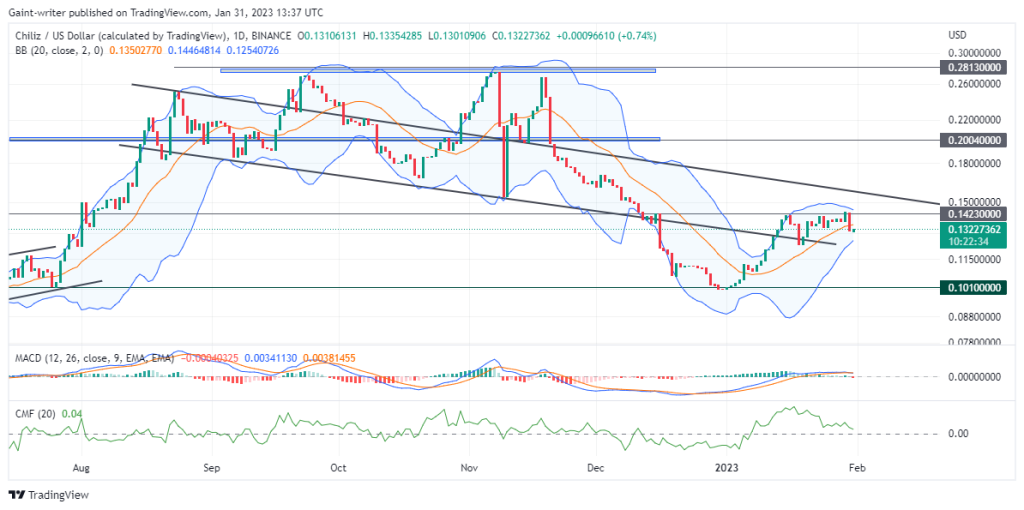
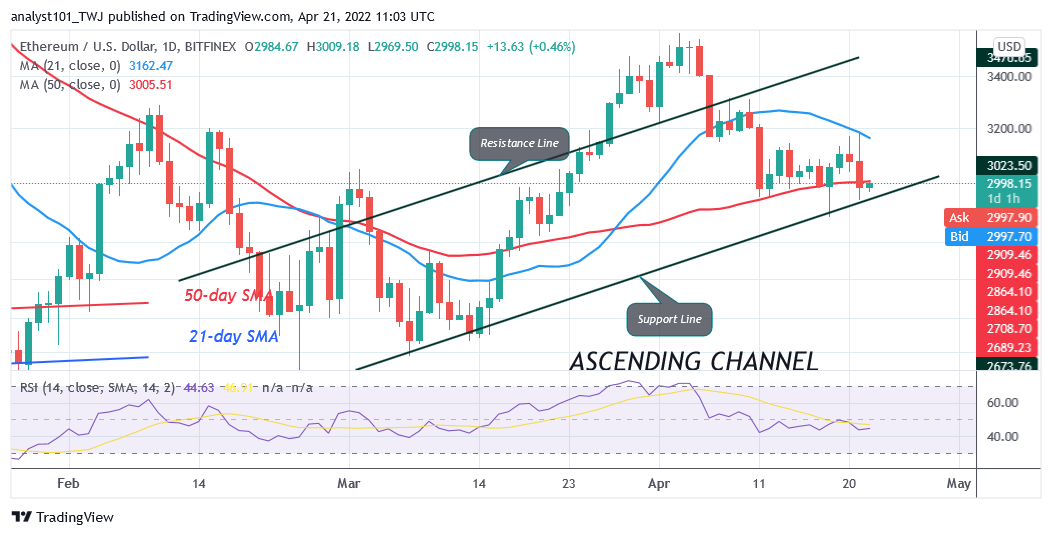
Ethereum’s (ETH) price is in a downtrend as it risks a possible decline. Ether’s price is making a series of lower highs and lower lows before finding support above $3,000. The largest cryptocurrency has been in a range-bound move since April 11. The coin has been trading above the 50-day line SMA but below the 21-day line SMA. Today, the bears are attempting to break below the 50-day line SMA. A break below the 50-day line SMA support will sink the largest altcoin to the low of $2,560. Meanwhile, Ether is trading at $3,005 as of press time.
Ethereum Indicator Analysis
Ether has fallen to level 44 of the Relative Strength Index for period 14. The market is still in the downtrend zone and below the centerline 50. The crypto’s price is between the moving averages but the bears are attempting to break below the moving averages. The altcoin is above 25% area of the daily stochastic. The bullish momentum is unstable and sloping horizontally .
Technical indicators:
Major Resistance Levels – $2, 600, $2,800, $3,000
Major Support Levels – $1.500, $1, 300, $1,100
.
What Is the Next Direction for Ethereum?
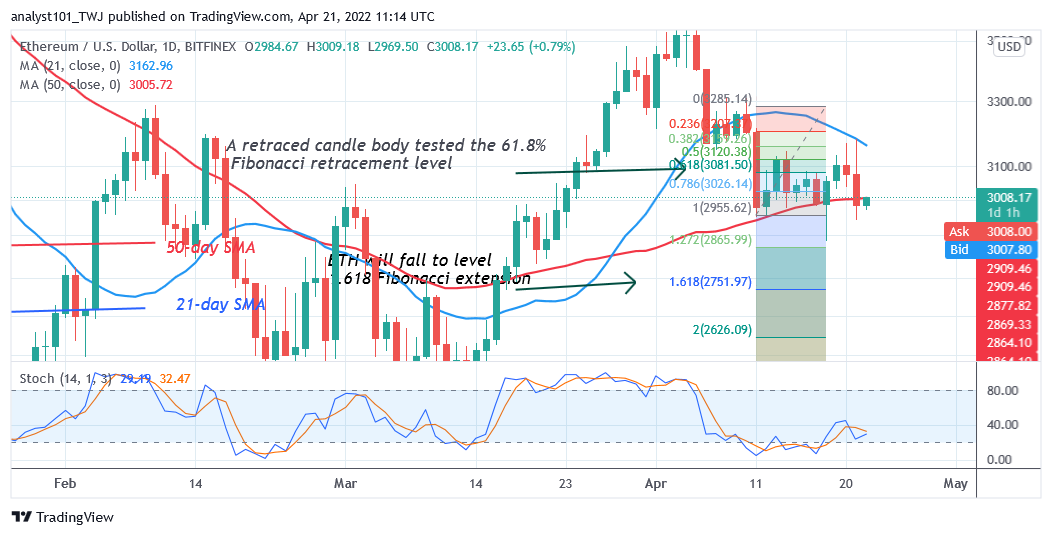
Ether price has broken below the 50-day line SMA as it risks a possible decline. The altcoin will fall to the low of $2,560 if the bearish momentum is sustained. Meanwhile, on April 11 downtrend; a retraced candle body tested the 61.8% Fibonacci retracement level. The retracement indicates that Ethereum will fall to level 1.618 Fibonacci extension or $2,865.99.
You can crypto coins here. Buy LBlock
Note: Cryptosignals.org is not a financial advisor. Do your research before investing your funds in any financial asset or presented product or event. We are not responsible for your investing results