Ethereum Consolidates Above $2,950 as Bears Sell at Each Rally
Estimated Reading Time: 3 minutes
Don’t invest unless you’re prepared to lose all the money you invest. This is a high-risk investment and you are unlikely to be protected if something goes wrong. Take 2 minutes to learn more

Free Crypto Signals Channel
Ethereum Price Long-Term Analysis: Bearish
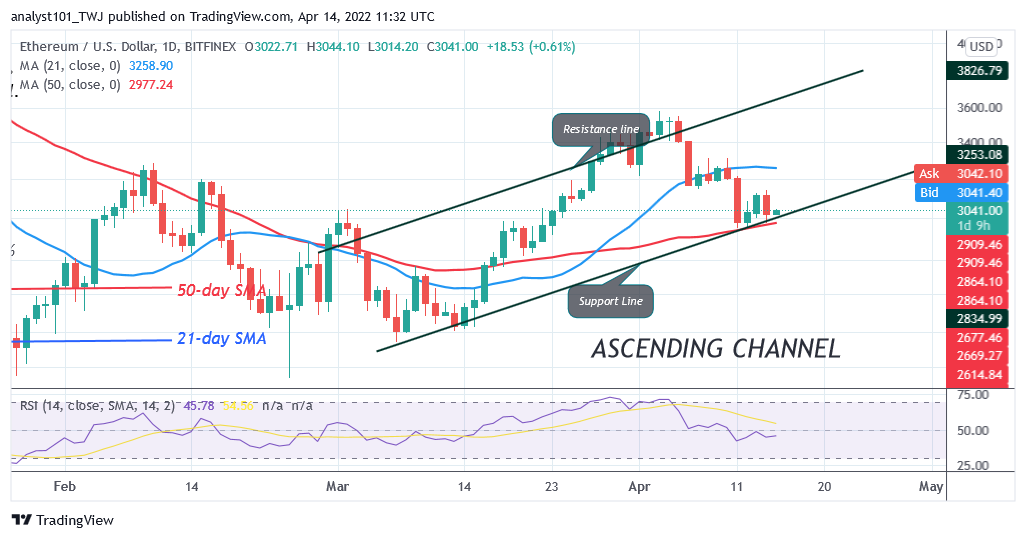
Ethereum’s (ETH) price is in downward correction as bears continue to sell at each rally. Today, the largest altcoin is fluctuating between the moving averages. Ether price is above the 50-day line SMA but below the 21-day line SMA. This implies that the altcoin will be compelled to a range-bound move between the moving averages. Presently, the ETH price is consolidating above the 50-day line SMA. A break below the 50-day line SMA support will sink the largest altcoin to the low of $2,560. On the other hand, a break above the 21-day line SMA will signal the resumption of the uptrend.
Ethereum Indicator Analysis
Ether has fallen to level 45 of the Relative Strength Index for period 14. The altcoin is in the downtrend zone and capable of falling to the downside. The crypto’s price is between the moving averages which indicate a possible range-bound move between the moving averages. The altcoin will trend when the moving average lines are breached. . The altcoin is below 40% area of the daily stochastic. Ether has resumed bearish momentum.
Technical indicators:
Major Resistance Levels – $2, 600, $2,800, $3,000
Major Support Levels – $1.500, $1, 300, $1,100
What Is the Next Direction for Ethereum?
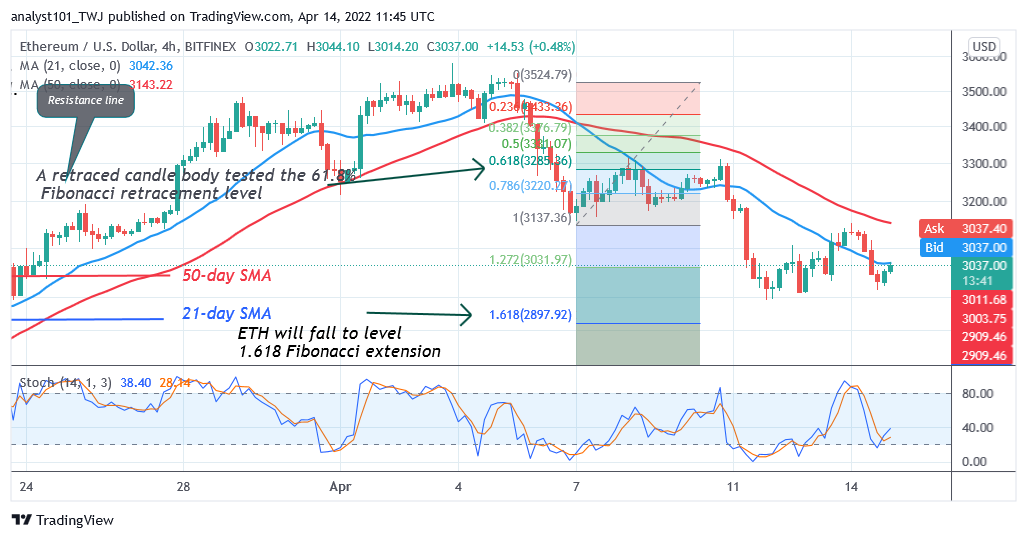
Ether is in a downtrend as the bears continue to sell at each rally. The altcoin is facing rejection at $3,300 and $3,120 price levels. The current uptrend is struggling to break the resistance at $3,035. Meanwhile, on April 6 downtrend; a retraced candle body tested the 61.8% Fibonacci retracement level. The retracement indicates that Ethereum will fall to level 1.618 Fibonacci extension or $2,897.92. From the price action, Ether fell to $2,951 low and it is attempting to reverse.
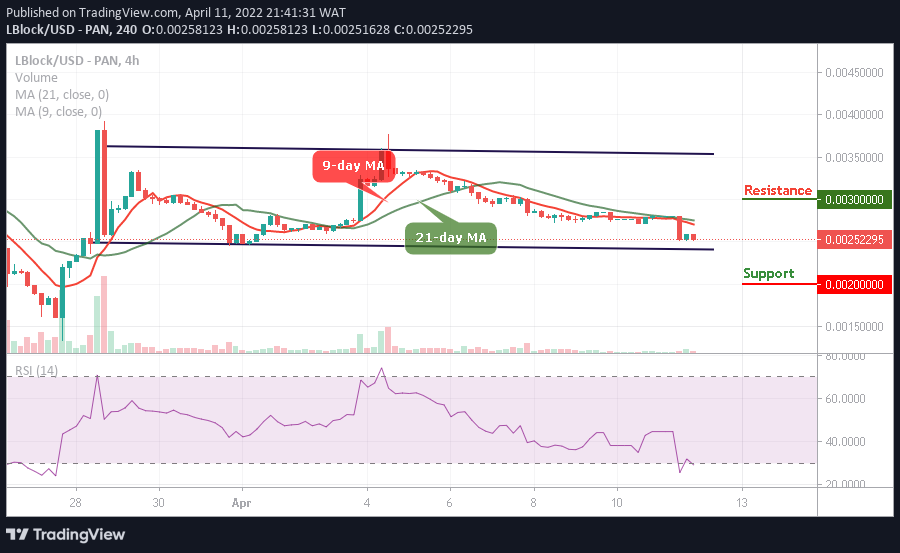
You can crypto coins here. Buy LBlock
Note: Cryptosignals.org is not a financial advisor. Do your research before investing your funds in any financial asset or presented product or event. We are not responsible for your investing results