Chainlink (LINK) Finds Support Above 30, Resumes a Fresh Uptrend
Estimated Reading Time: 2 minutes
Don’t invest unless you’re prepared to lose all the money you invest. This is a high-risk investment and you are unlikely to be protected if something goes wrong. Take 2 minutes to learn more
Chainlink (LINK) Long-Term Analysis: Bullish
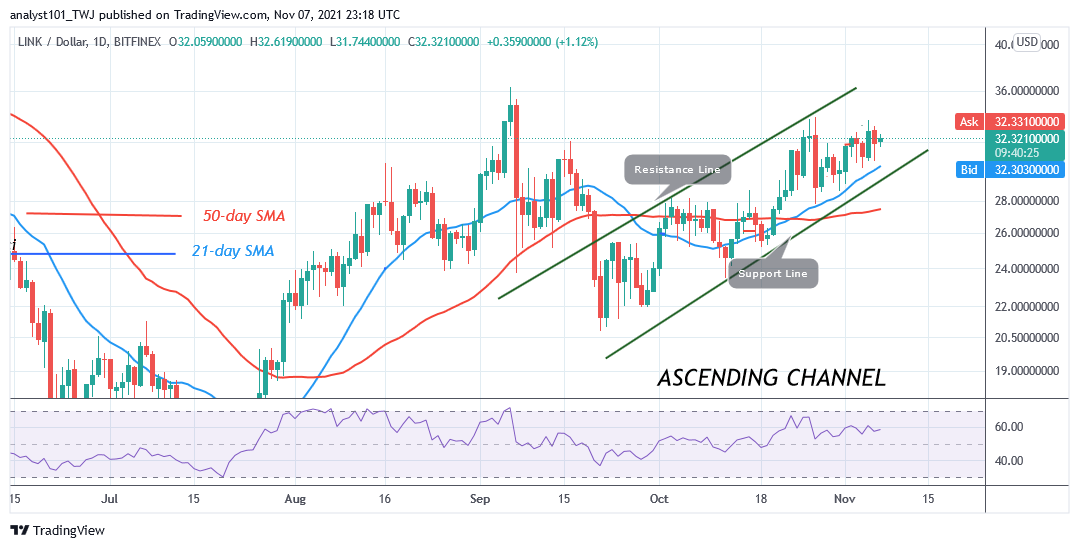
Chainlink (LINK) is trading above the moving averages indicating a possible upward move of the crypto. In the previous price action, the altcoin retested the $34 resistance zone and was resisted. Then it retraced to $30 low and resumed an uptrend. If buyers clear the resistance at $34, a rally above $36 is expected. The resistance at $34 has not been broken since May 25. Today, the cryptocurrency is rising and has reached the high of $32 at the time of writing.
Chainlink (LINK) Indicator Analysis
Chainlink is at level 58 of the Relative Strength index period 14. The altcoin is in the bullish trend zone and above the centerline 50. There is a tendency for altcoin to rise. Chainlink has a bullish crossover. That is, the 21-day SMA crosses above the 50-day SMA indicating a buy signal. The 21-day and 50-day SMA are sloping upward indicating the uptrend. . LINK is above the 25% range of the daily stochastic. The market is in a bullish momentum.
Technical indicators:
Major Resistance Levels – $40.00, $42.00, $44.00
Major Support Levels – $26.00, $24.00, $22.00
What Is the Next Direction for Chainlink (LINK)?
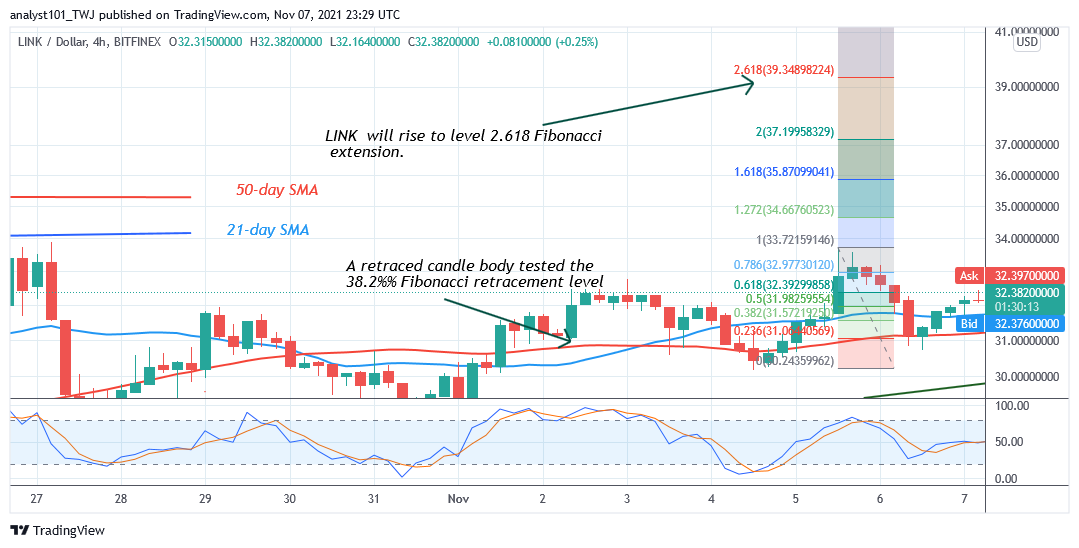
On the 4-hour chart, LINK has resumed an upward after the rejection at level $34. Buyers are pushing the altcoin to retest the resistance at $34. Meanwhile, on November 5 uptrend, a retraced candle body tested the 38.2%% Fibonacci retracement level. The retracement indicates that LINK will rise to level 2.618 Fibonacci extension or $39.34.
You can purchase crypto coins here. Buy Token
Note: Cryptosignals.org is not a financial advisor. Do your research before investing your funds in any financial asset or presented product or event. We are not responsible for your investing results