POL (Prev. MATIC) Price Prediction: POL/USDT Tries to Advance Its Bullish Retracement
Estimated Reading Time: 2 minutes
Don’t invest unless you’re prepared to lose all the money you invest. This is a high-risk investment and you are unlikely to be protected if something goes wrong. Take 2 minutes to learn more

Date: December 20, 2025
The POL (prev. MATIC) market has experienced a prolonged downward correction that lasted several months. During this period, there were instances of short-term gains, after which the market returned to its broader downward path. Similarly, the market now appears to be experiencing another phase of short-term bullish retracement. Let’s examine how this may unfold below.
POL/USDT Long-Term Trend—Bearish (Daily Chart)
Key Price Levels:
Resistance: $0.1500, $0.1750, $0.2000
Support: $0.1200, $0.1000, $0.0800

The previous session in the POL (prev. MATIC) daily market produced a notable upward rebound. Interestingly, the ongoing session is forming a small and fragile green candle below the 9-day Exponential Moving Average (EMA). Meanwhile, the Stochastic Relative Strength Index (SRSI) indicator lines are rising from the oversold region.
POL/USDT Price Prediction: POL (Prev. MATIC) Stays on a Recovery Path (Daily Chart)
Although price action appears to be facing an uphill task, given the position of the most recent candle, the market remains on a path toward continued upward retracement. The latest price candle has managed to remain green at the time of writing.
However, price action still remains below the 9-day EMA, keeping upside momentum under pressure and limiting bullish movement. Despite this, the SRSI lines continue to trend upward, suggesting that the market may remain on a recovery path.
POL/USDT Price Prediction: POL (Prev. MATIC) Bulls May Tire Easily but Have a Good Base (4-Hour Chart)
Observing the POL (prev. MATIC) market on the 4-hour chart reveals that price action has moved above a key technical level. The most recent price candle is green and stands above the 9-day EMA.
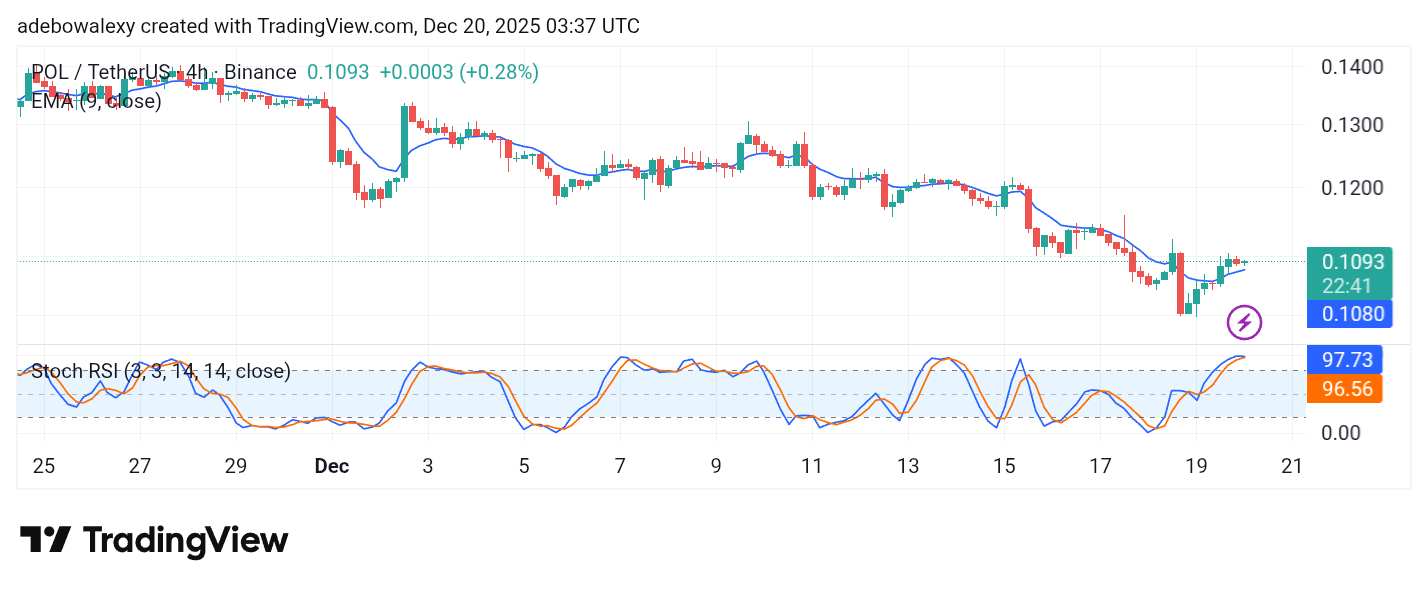
Meanwhile, the SRSI indicator lines are converging in the overbought region, signaling a potential short-term pullback. Consequently, price action may retrace toward the 9-day EMA, which could act as a higher support level before a potential continuation toward the $0.1200 price level.