POL (prev. MATIC) Price Prediction: POL/USDT Finds a Base at $0.1200
Estimated Reading Time: 2 minutes
Don’t invest unless you’re prepared to lose all the money you invest. This is a high-risk investment and you are unlikely to be protected if something goes wrong. Take 2 minutes to learn more
Date: December 13, 2025
The POL (prev. MATIC) remains subdued. Price action can be seen dragging sideways at the psychological support at the $0.1200 mark. In fact, the latest price movement seems to largely lack enough momentum.
POL/USDT Long-Term Trend — Bearish (Daily Chart)
Key Price Levels:
Resistance: $0.1500, $0.1750, $0.2000
Support: $0.1200, $0.1000, $0.0800
Price activity stays concealed below the 9-day Exponential Moving Average. The ongoing session is represented by a small green price candle. The Stochastic Relative Strength Index (SRSI) indicator lines are above the 70 threshold level. Meanwhile, the lead line of the indicator is taking a sideways trajectory. The general trajectory of the line, however, stays downward and toward the 70 level.
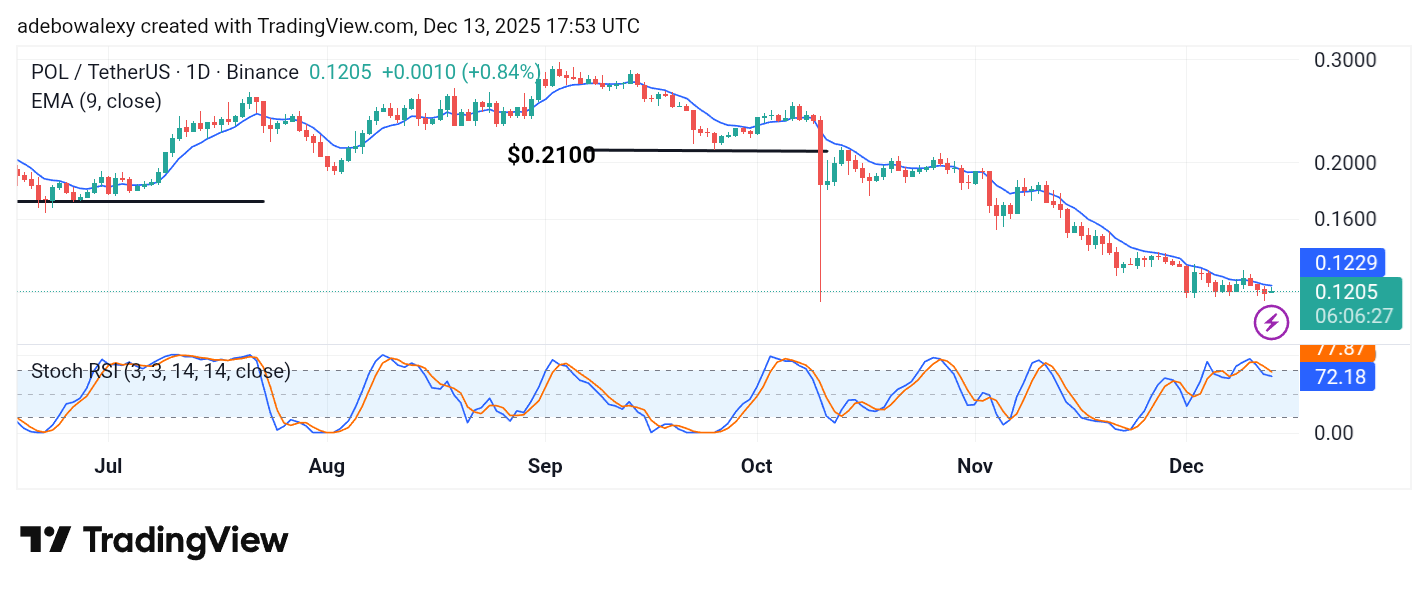
POL/USDT Price Prediction: POL (prev. MATIC) Headwinds Continue to Dominate
Headwinds have really dominated the POL (prev. MATIC) market. On the daily chart, price action can be seen to have descended spontaneously toward the baseline at the $0.2100 price level.
Ever since, this market has been proceeding downhill. The last price candle on the chart has a green appearance but stays compressed below the 9-day EMA curve. Although the SRSI lines are deflected toward the side, the general bearish trajectory stays on.
POL/USDT Price Prediction: POL (prev. MATIC) Yields to Headwinds (4-Hour Chart)
While the POL (prev. MATIC) on a 4-hour price chart seems to have a bit of lift, it appears downward forces are still keeping dominance.
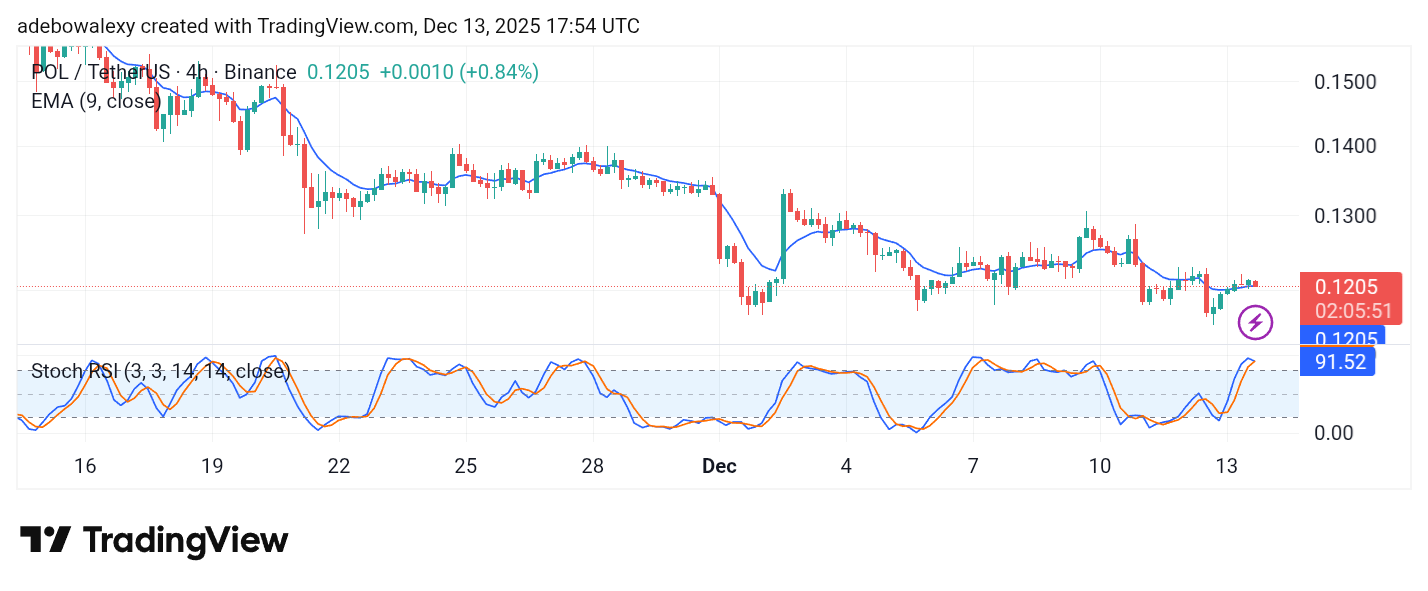
The current session is represented by a bearish price candle but brings the coin to trade at the level of the SRSI line.
The lines of the SRSI indicator are in the overbought region. The terminals of the indicator lines are converged but stand above the 9-day EMA curve. Technically, this market appears still under the influence of bearish forces and may still test the $0.1000 level at least.