Dogecoin (DOGE) Price Prediction: DOGE/USDT Upward Retracement Faces Resistance Near the $0.1300 Threshold
Estimated Reading Time: 3 minutes
Don’t invest unless you’re prepared to lose all the money you invest. This is a high-risk investment and you are unlikely to be protected if something goes wrong. Take 2 minutes to learn more

Dogecoin (DOGE) Price Prediction: September 30
Following the upsurge in the Bitcoin market, other cryptocurrencies, such as Dogecoin, witnessed a significant strengthening. This caused the token’s price action to break through a medium-term resistance at $0.1086. The market advanced in subsequent sessions until the trend reversed around the $0.1300 threshold.
DOGE/USDT Long-term Trend: Bullish (Daily Chart)
Key Price Levels:
Resistance: $0.1300, $0.1500, $0.1700
Support: $0.1000, $0.0800, $0.0600
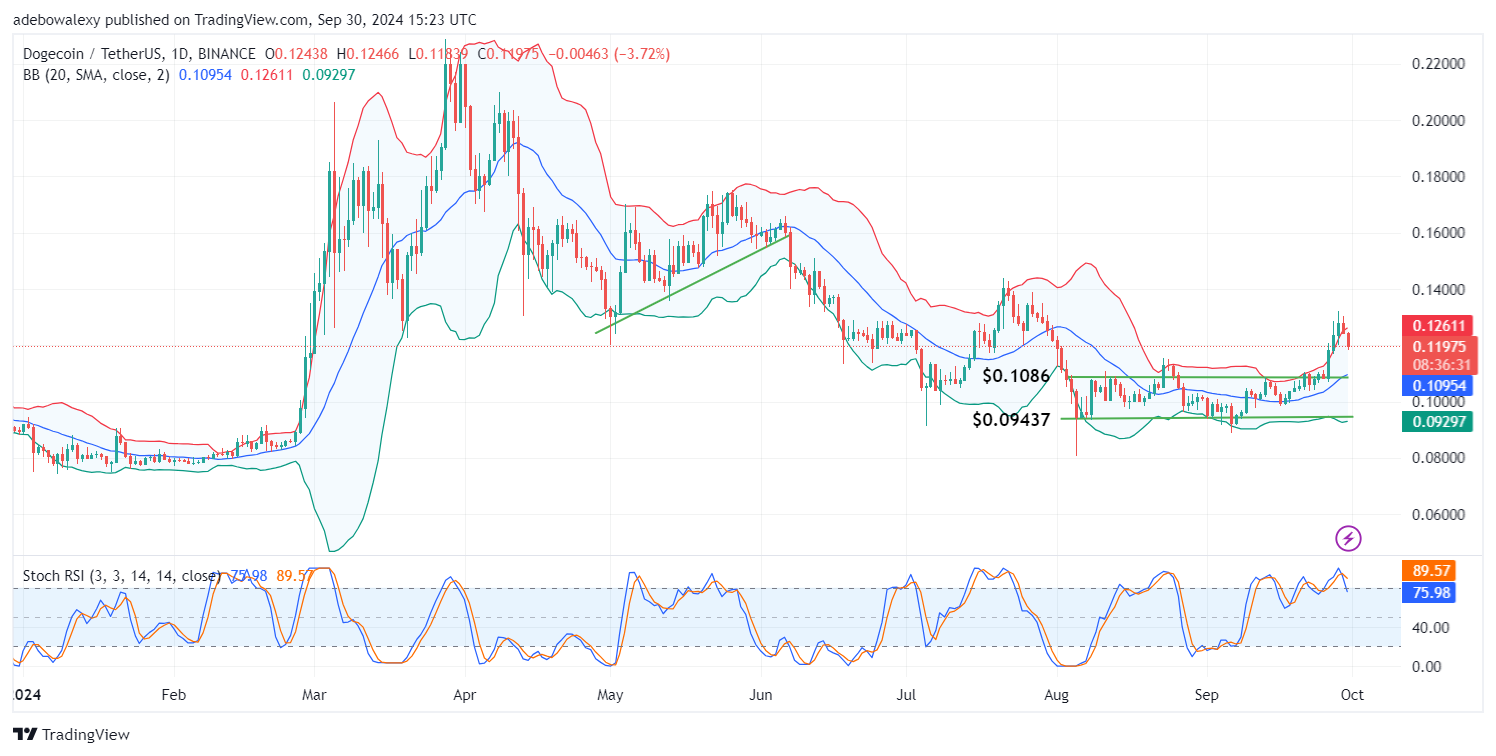
As a result, price activity has taken a downward turn in more recent sessions. The market has moved towards lower levels with moderate volatility. This occurred after the market pushed against the upper limit of the Bollinger Bands (BB) indicator for a while. On the daily chart, it can be observed that price activity remains above the middle band of the BB indicator. Meanwhile, the Stochastic Relative Strength Index (Stochastic RSI) lines are falling towards the 80 level of the indicator.
Dogecoin (DOGE) Price Prediction: DOGE/USDT Heads for Lower Support Levels
Price activity in the Dogecoin daily market is reacting to headwinds. The token’s price action can be seen retracing to lower levels after pushing technical limits. The market has continued on a bearish path today following rejection in the previous session as Bitcoin bears bounced back.
However, on this price chart, the market remains above the middle limit of the Bollinger Bands. Nevertheless, the trajectory of the Stochastic RSI following a crossover in the overbought region signals that downward forces may gain more traction in subsequent sessions. Combined with favorable fundamentals, these factors will provide short-term traders with more profit opportunities.
Dogecoin (DOGE) Price Prediction: DOGE/USDT Retraces to Support (4-Hour Chart)
Extending the scope of this price analysis to the DOGE/USDT 4-hour market reveals that price action may have found support. Price action on the chart has fallen through the middle limit of the Bollinger Bands. As a result, the last price candle representing the ongoing session can be seen standing just above the lower limit of the BB indicator.
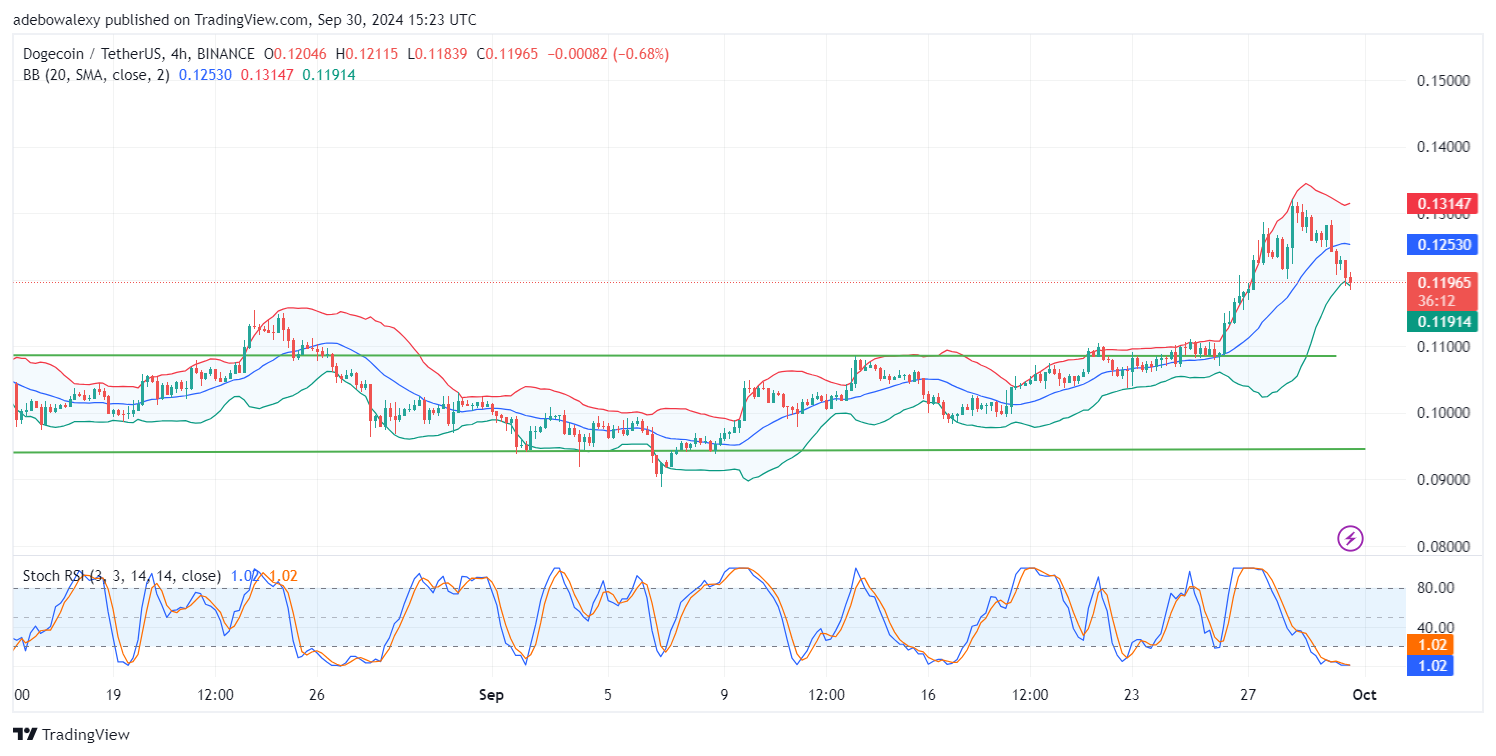
Meanwhile, the Stochastic RSI lines are now at the peak of the oversold region. Although the market may fall lower, since it appears the Stochastic RSI lines are positioned to remain in the oversold region, the body of the last price candle is contracting upwards. This suggests the possibility of a rebound. Therefore, traders can anticipate a bounce towards the $0.1255 mark.