Polygon (POL) Price Prediction: POL/USDT Heads Toward the $0.5000 Threshold
Estimated Reading Time: 3 minutes
Don’t invest unless you’re prepared to lose all the money you invest. This is a high-risk investment and you are unlikely to be protected if something goes wrong. Take 2 minutes to learn more

Polygon (POL) Price Prediction: September 28
Price activity in the Polygon market has picked up a new trajectory since the project migrated from the MATIC chain to the Polygon chain. As a result, the market seems to be improving and may see further improvement in subsequent sessions.
POL/USDT Long-term Trend: Bullish (Daily Chart)
Key Price Levels:
Resistance: $160.00, $170.00, $180.00
Support: $155.00, $150.00, $145.00
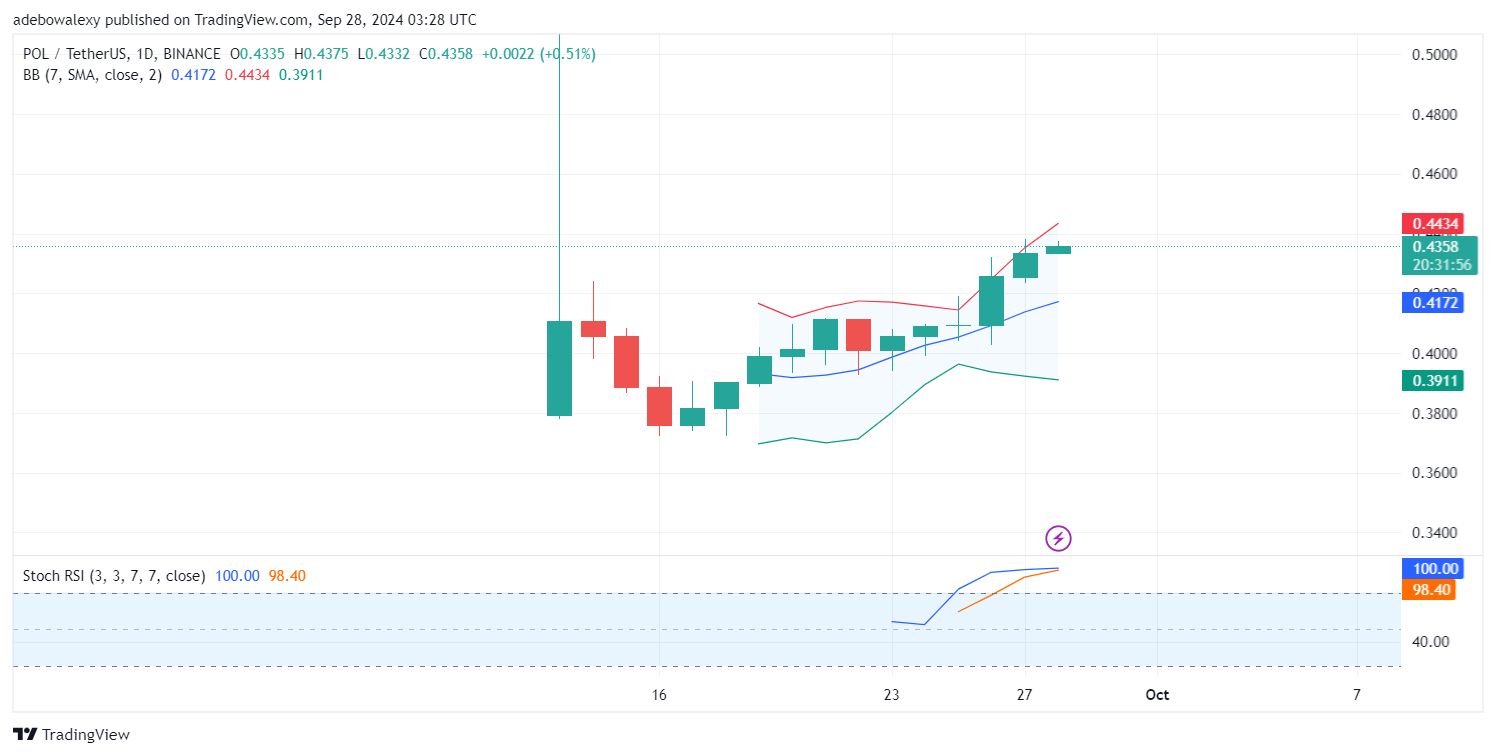
Since price action on the Polygon daily chart hit support around the $0.3700 threshold in the past twelve sessions, it has steadily risen, moving from one higher high to another. The latest price candle is green and positioned near the uppermost limit of the Bollinger Bands (BB) indicator. Additionally, the Stochastic RSI lines are converging in the overbought region.
Polygon (POL) Price Prediction: POL/USDT May Still Break the $0.5000 Threshold
Price activity on the POL/USDT daily chart reveals that upward momentum remains dominant and may continue to propel the market higher. The latest price candle remains near the upper band of the Bollinger Bands indicator, despite the reduced volatility indicated by the ongoing session’s corresponding price candle.
Moreover, the Stochastic RSI indicator shows the lines converging in the overbought region. However, these lines do not appear ready to cross over just yet. As a result, the indicator may linger at this level, which could provide the market with the opportunity to break through the next psychological level.
Polygon (POL) Price Prediction: POL/USDT Buyers Are Retaining Their Stand (4-Hour Chart)
Looking at the POL/USDT 4-hour chart, the market remains on a bullish trajectory. The BB indicator is slightly tilted upward, while the latest price candle is solid green and positioned above the previous one. The Stochastic RSI lines converge for a bullish crossover just below the 80 mark of the indicator.
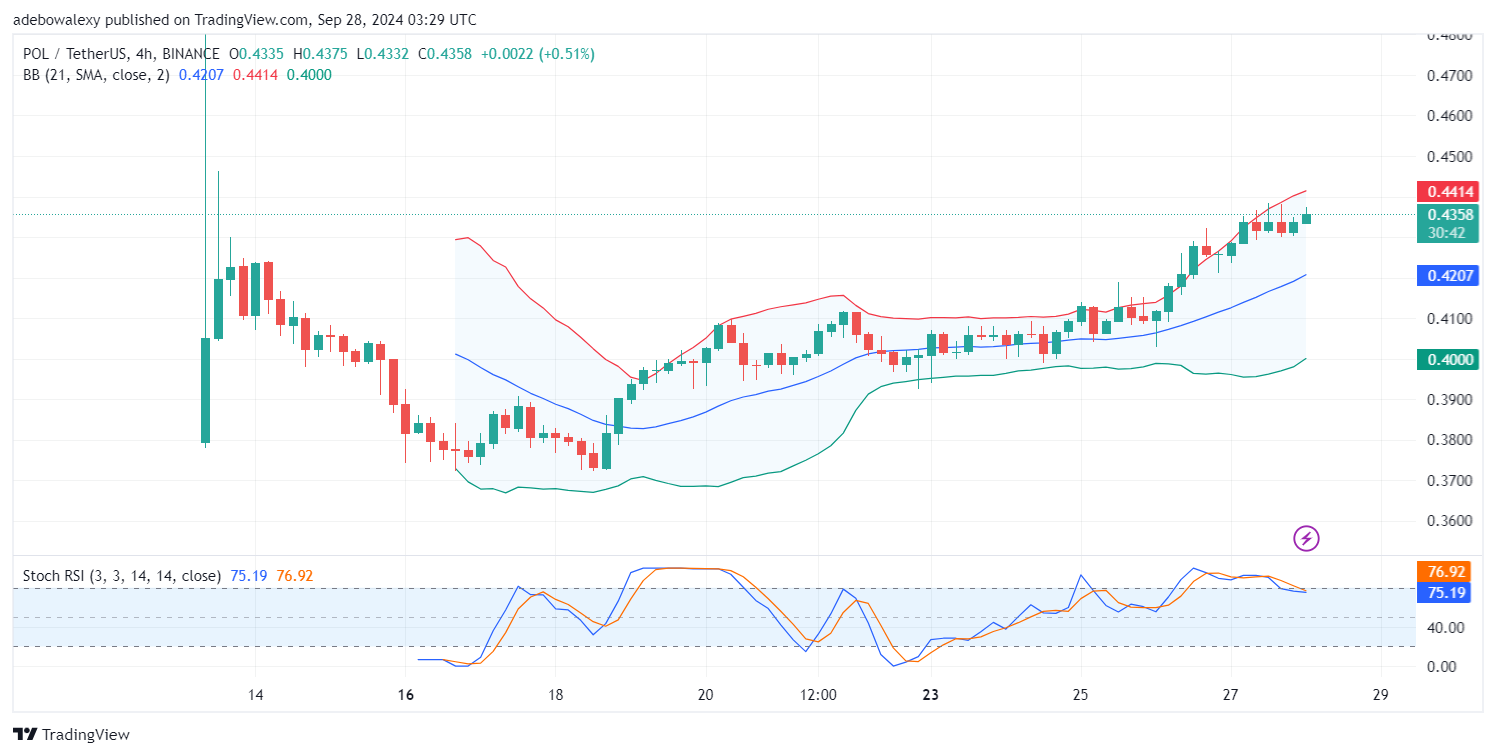
Technically, the appearance of the latest price candle above the previous one suggests that the market may have exited a short consolidation period that lasted four sessions. Consequently, it seems possible for price action to rise past the resistance at the $0.5000 threshold toward the $0.5500 mark.


