Solana (SOL) Price Prediction: SOL/USDT Closes in on the $160 Mark
Estimated Reading Time: 3 minutes
Don’t invest unless you’re prepared to lose all the money you invest. This is a high-risk investment and you are unlikely to be protected if something goes wrong. Take 2 minutes to learn more

Solana (SOL) Price Prediction: September 27
The Solana token continues to trade above the $155.00 threshold since the market broke through that resistance level. Indications that the market may still proceed upward can be observed on the price chart, so let’s zoom in on the action.
SOL/USDT Long-term Trend: Bullish (Daily Chart)
Key Price Levels:
Resistance: $160.00, $170.00, $180.00
Support: $155.00, $150.00, $145.00
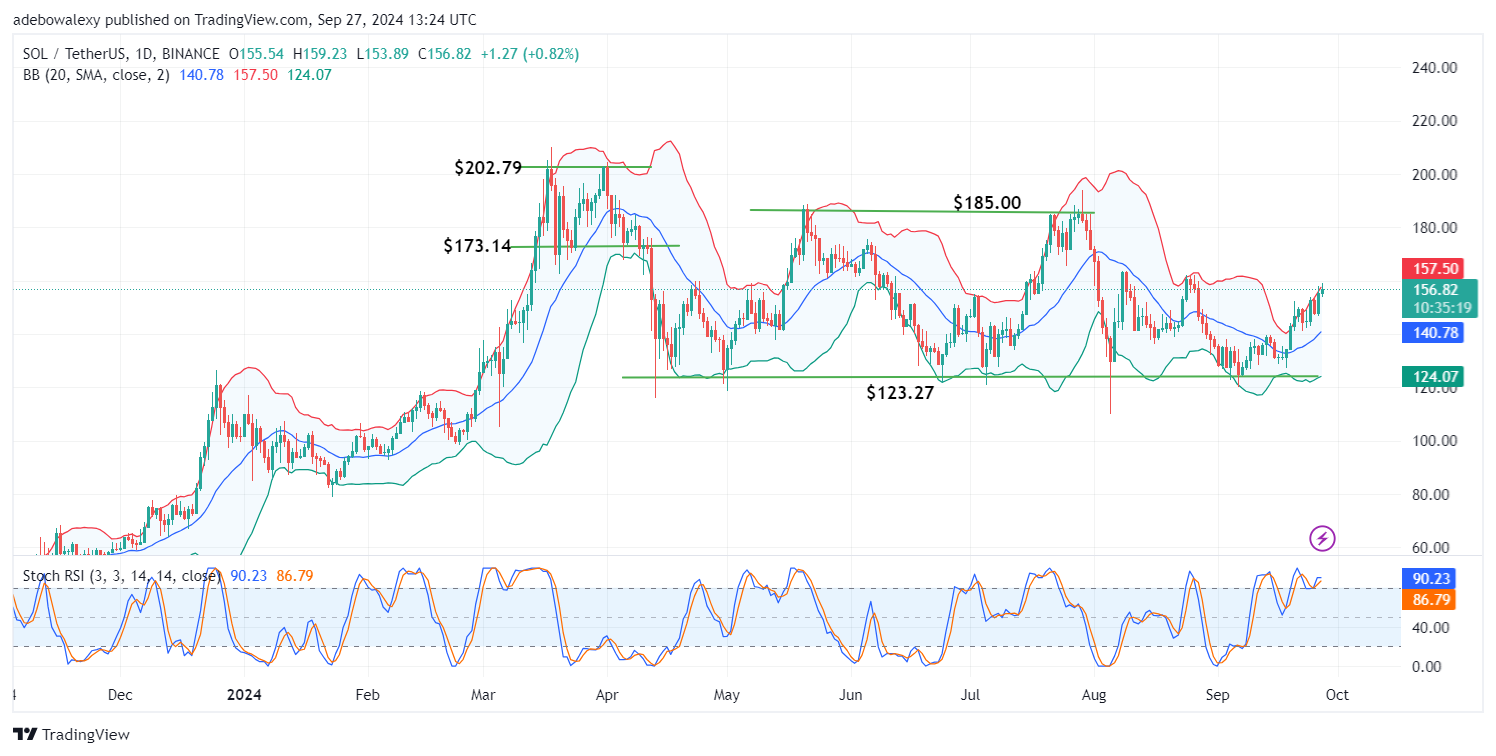
The SOL/USDT market has followed an upward trajectory since its price action bounced off the support at the $123.27 baseline as of the latest update. However, upside momentum appears to have strengthened as price activity rose through the middle limit of the Bollinger Bands (BB) Indicator. The BB indicator itself has taken an upward trajectory, indicating the prevailing trend in the market. Additionally, the Stochastic Relative Strength Index (SRSI) lines remain in the overbought region despite the deflection seen in the leading line of the indicator.
Solana (SOL) Price Prediction: SOL/USDT Bulls Are Taking a Brave Stand
Price movement in the Solana daily market can be observed pushing upward, aided by the most recent price candle. The size of the corresponding price candle suggests that upside momentum may be diminishing. Nevertheless, the market continues to push forward.
Price activity in the daily market remains near the upper limit of the BB indicator, suggesting that upward forces may continue to drive the market. The Stochastic RSI remains in the overbought region, but its leading curve signals that downward forces are emerging through its deflection.
Solana (SOL) Price Prediction: SOL/USDT Bulls Are Trying to Exhaust the Bears (4-Hour Chart)
Price activity in the Solana 4-hour market can still be seen hugging the uppermost limit of the Bollinger Bands, despite the deflection observed in the previous session. The ongoing session remains bullish, as indicated by the corresponding price candle. Moreover, the BB indicator continues to move upward. Meanwhile, the Stochastic RSI appears lines tangled around the 80 mark of the indicator.
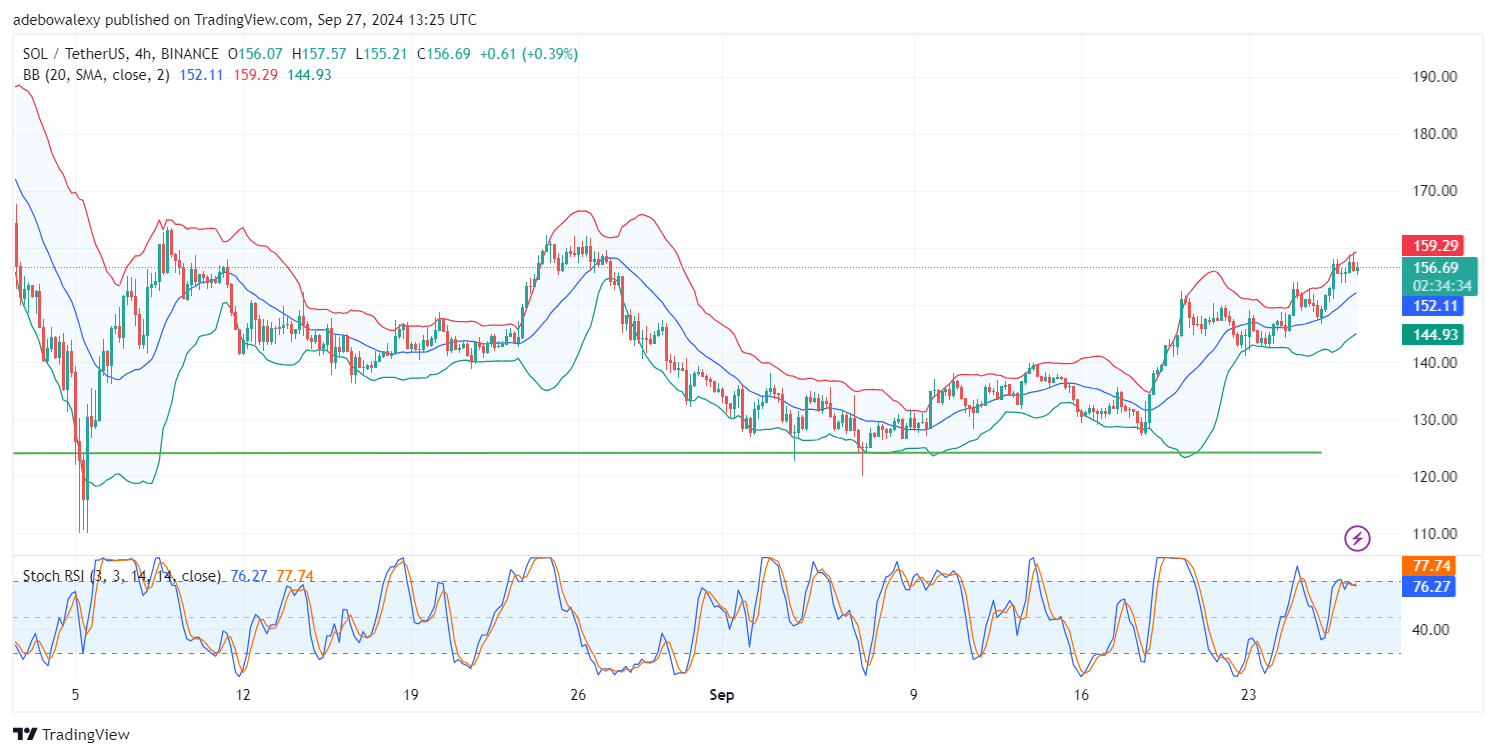
Technical indicators suggest that upward forces are trying to prevent a notable downward retracement. Therefore, traders can maintain long positions in this market but should take necessary precautions to avoid being prematurely stopped out, as the market may eventually break through the $160.00 ceiling.