POL (prev. MATIC) Price Prediction: POL/USDT Eyes a New Low
Estimated Reading Time: 2 minutes
Don’t invest unless you’re prepared to lose all the money you invest. This is a high-risk investment and you are unlikely to be protected if something goes wrong. Take 2 minutes to learn more

Date: December 6, 2025
The POL (formerly MATIC) market hasn’t been able to shake off persistent headwinds. As a result, the market remains trapped below key bearish levels on technical indicators. From here, the market seems to be eyeing support at the $0.1000 price level.
POL/USDT Long-Term Trend — Bearish (Daily Chart)
Key Price Levels:
Resistance: $0.1200, $0.1500, $0.1800
Support: $0.1100, $0.1000, $0.0900
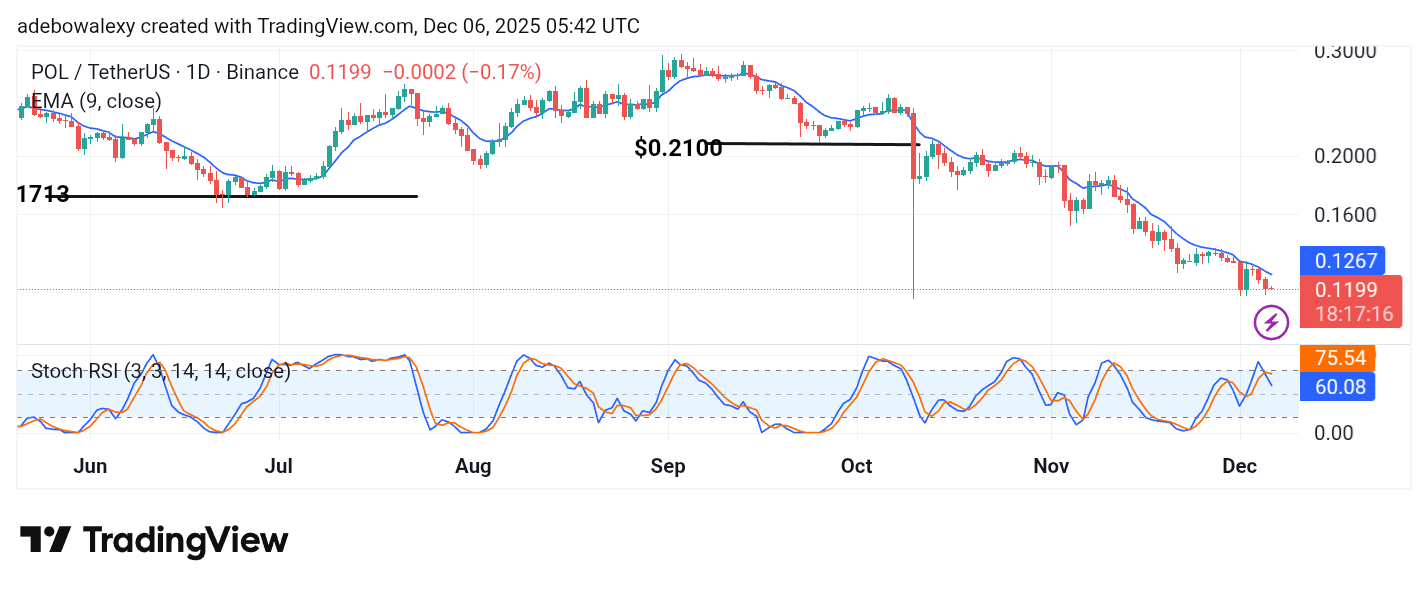
On the daily chart, the POL market has continued to trickle downward in recent sessions. The latest price candle is red and positioned noticeably below the 9-day Exponential Moving Average (EMA) curve. Likewise, the lines of the Stochastic Relative Strength Index (SRSI) have formed a downward crossover just below the 80 mark.
POL/USDT Price Prediction: POL (prev. MATIC) Pokes Through a Psychological Base
With POL (prev. MATIC) trading around $0.1199 at the time of writing, price action has breached the support at the $0.1200 level. Additionally, price has moved further below the 9-day EMA curve, signaling clear bearish dominance.
The SRSI indicator lines have also shaped into a formation that suggests the market is aligning with a bearish trajectory. Considering these signals, the market appears headed toward lower price levels.
POL/USDT Price Prediction: POL (prev. MATIC) Keeps Yielding to Bearish Pressure (4-Hour Chart)
On the 4-hour chart, POL has begun yielding to bearish pressure once again. The most recent price candle is red, erasing the gains recorded in the previous session.
Meanwhile, the SRSI indicator lines are pushing upward, though this may simply reflect the earlier upward movement from the previous session.
Despite this brief indicator bounce, price action remains below the 9-day EMA curve. As such, the market suggests a bearish retracement toward lower price levels around $0.1100 and potentially $0.1000 afterward.