POL (prev. MATIC) Price Prediction: POL/USDT Keeps Struggling
Estimated Reading Time: 3 minutes
Don’t invest unless you’re prepared to lose all the money you invest. This is a high-risk investment and you are unlikely to be protected if something goes wrong. Take 2 minutes to learn more
Date: November 29, 2025
Ever since price activity in the POL (prev. MATIC) market crashed to the $0.1200 level, upside recovery hasn’t been easy. This has kept price action below some important technical levels, suggesting that headwinds still maintain notable dominance.
POL/USDT Long-Term Trend — Bearish (Daily Chart)
Key Price Levels:
Resistance: $0.1400, $0.1800, $0.2200
Support: $0.1300, $0.1100, $0.0900
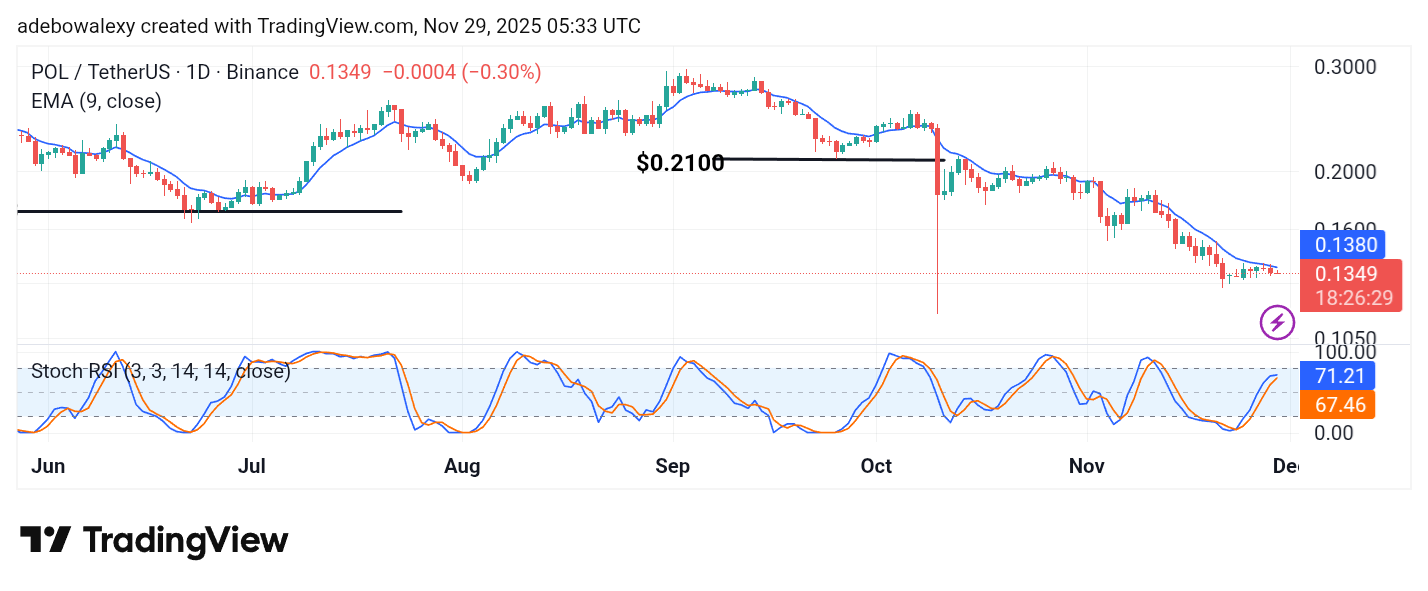
The POL (prev. MATIC) market has been on a downward retracement for the past two sessions. This started after price action tested resistance at the 9-day Exponential Moving Average (EMA). The ongoing daily session remains bearish below the 9-day EMA curve. The Stochastic Relative Strength Index (SRSI) indicator lines have risen to quite a height despite minimal price movement. The terminals of these indicator lines can be seen converging above the 80 mark.
POL/USDT Price Prediction: POL (prev. MATIC) Isn’t Ready for the Upside
Price activity in the POL (prev. MATIC) daily market hasn’t been able to overcome bearish sentiment. The market has remained below the 9-day EMA for the past 18 sessions. More recently, it seems to have found a strong baseline; however, it still hasn’t been able to push past the barrier formed by the 9-day EMA.
While the market has only seen minimal movement, the applied SRSI indicator lines have risen deep into the overbought region. This signals that bullish forces are weak and may not offer much resistance against bearish pressure.
POL/USDT Price Prediction: POL (prev. MATIC) Remains in Deep Waters (4-Hour Chart)
On the 4-hour chart, the POL (prev. MATIC) market appears to confirm that price action may not yet be ready for any significant upside. Recent candles remain below the 9-day EMA curve. Additionally, the SRSI indicator lines are dropping rapidly into the oversold region.
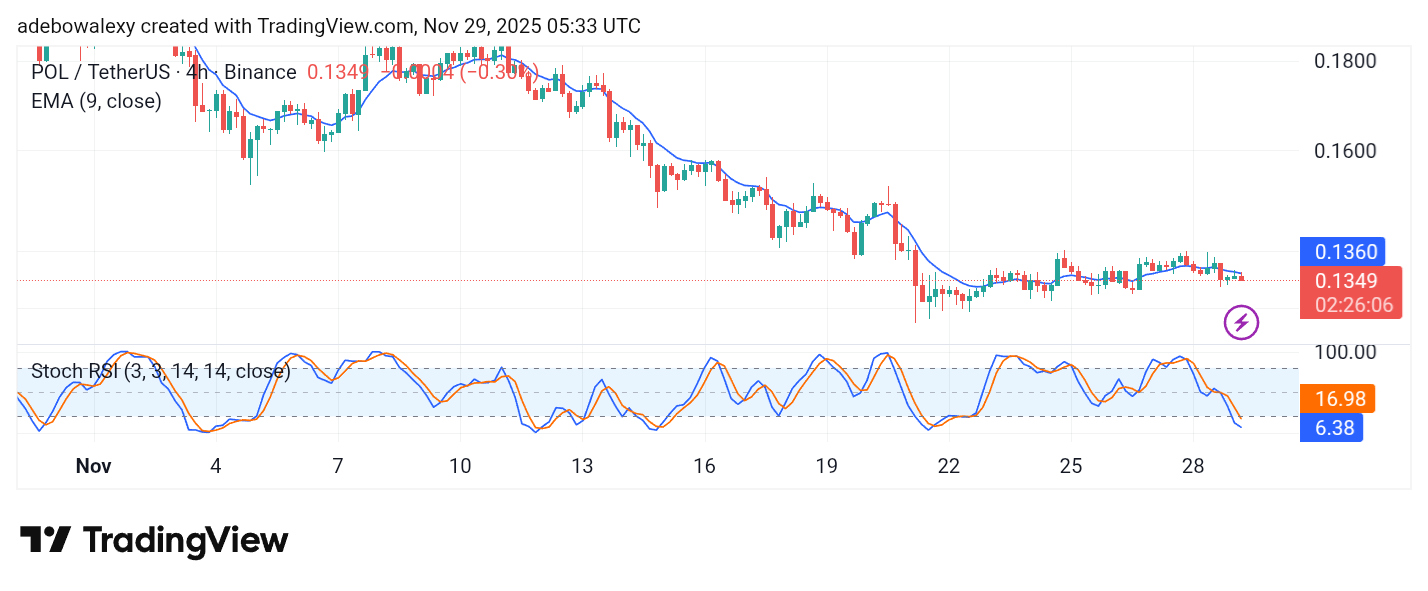
The lead line of the SRSI indicator is deflecting slightly sideways within the oversold area while price action appears to be mostly consolidating.
Combining the daily and 4-hour charts, it appears that not much upside should be expected from this market, and price may descend toward the $0.1300 level.