POL (prev. MATIC) Price Prediction: POL/USDT Keeps Falling Headlong
Estimated Reading Time: 2 minutes
Don’t invest unless you’re prepared to lose all the money you invest. This is a high-risk investment and you are unlikely to be protected if something goes wrong. Take 2 minutes to learn more

Date: November 22, 2025
As the crypto market continues to dive, the price of POL (prev. MATIC) remains on its medium-term bearish path. The market appears firmly headed toward the baseline at the $0.1100 price level.
POL/USDT Long-Term Trend—Bearish (Daily Chart)
Key Price Levels:
Resistance: $0.1400, $0.1800, $0.2200
Support: $0.1300, $0.1100, $0.0900
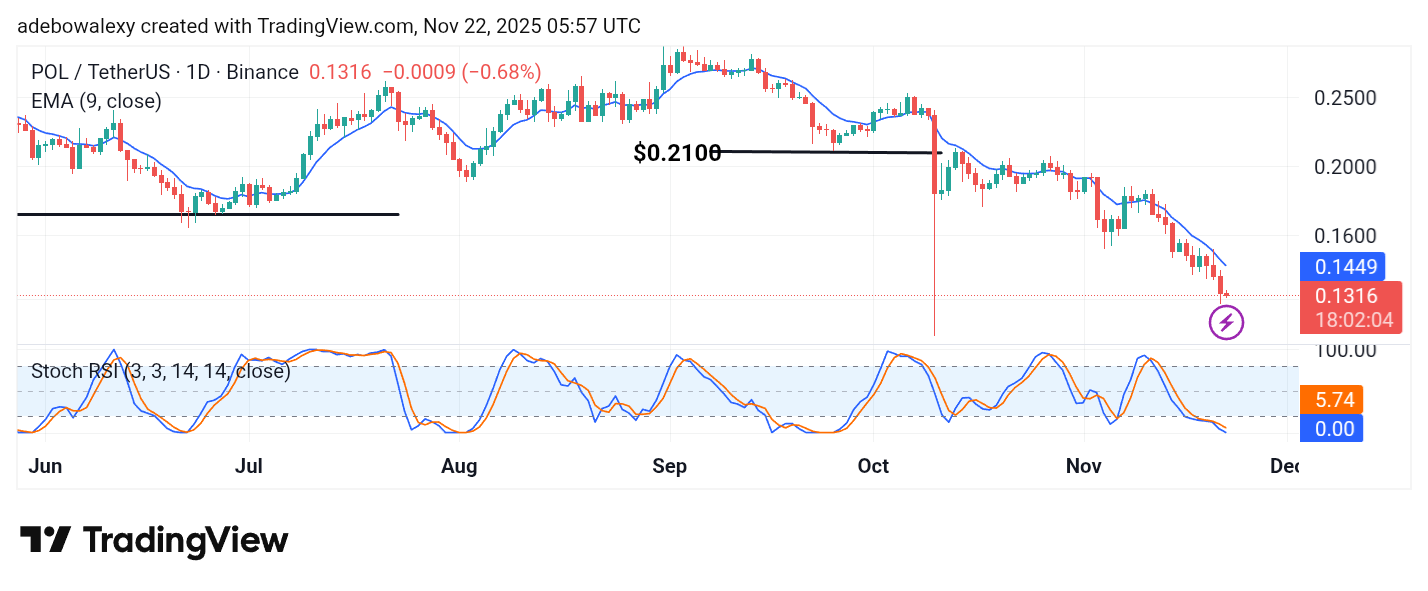
The POL (prev. MATIC) market has continued descending toward lower price levels in the ongoing session. In fact, for the past eleven sessions, price action has maintained a bearish course. As a result, trading remains confined below the 9-day Exponential Moving Average (EMA) line. The Stochastic Relative Strength Index (SRSI) indicator lines are also deep within the oversold zone. Meanwhile, the current session’s price candle has appeared small but remains red.
POL/USDT Price Prediction: POL (prev. MATIC) Buyers Are on the Sidelines
From current price movements, it is clear that price action has continued its downward trajectory. It also remains below the 9-day EMA line.
The SRSI indicator lines stay pointed south and are already deep inside the oversold region. Therefore, signals from the POL (prev. MATIC) daily chart do not suggest any imminent trend reversal.
POL/USDT Price Prediction: POL (prev. MATIC) Still Yielding to Bearish Pressure (4-Hour Chart)
On the 4-hour chart, the POL (prev. MATIC) market recently consolidated for several sessions. During that time, it briefly looked as though a rebound might occur. However, the ongoing session paints a different picture.
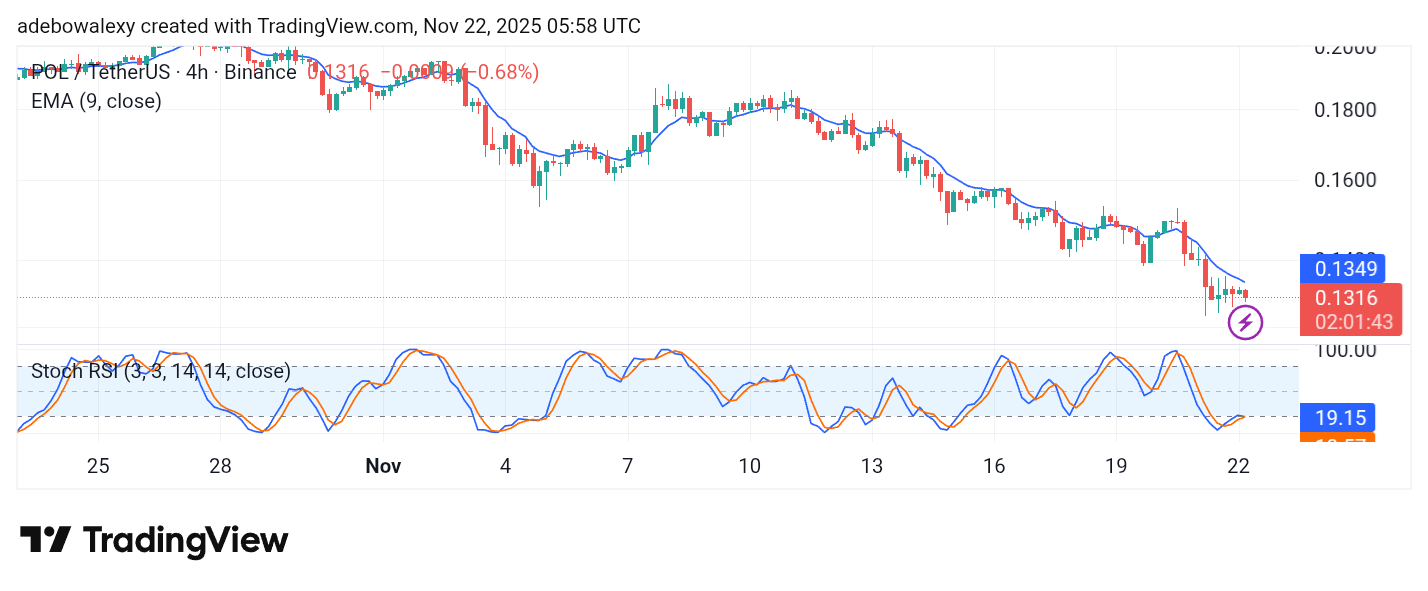
The latest price candle shows stronger bearish momentum compared to previous sessions. As price action drops further below the 9-day EMA curve, the SRSI indicator lines show a slight upward tilt but are converging toward a bearish crossover at their terminals. Therefore, the market may be on track to reach the $0.1100 price level.