Uniswap Price Prediction: UNI/USDT Eyes the $12.00 Support
Estimated Reading Time: 3 minutes
Don’t invest unless you’re prepared to lose all the money you invest. This is a high-risk investment and you are unlikely to be protected if something goes wrong. Take 2 minutes to learn more

Uniswap Price Prediction (December 26):
Since price action broke below the $18.00 price level, it has been retracing to lower levels. This is evident as price action continues to make lower lows. More recently, the market has been falling moderately downward.
UNI/USDT Long-Term Trend: Bearish (Daily Chart)
Key Price Levels:
Resistance: $14.00, $16.00, $18.00
Support: $13.00, $11.00, $9.00
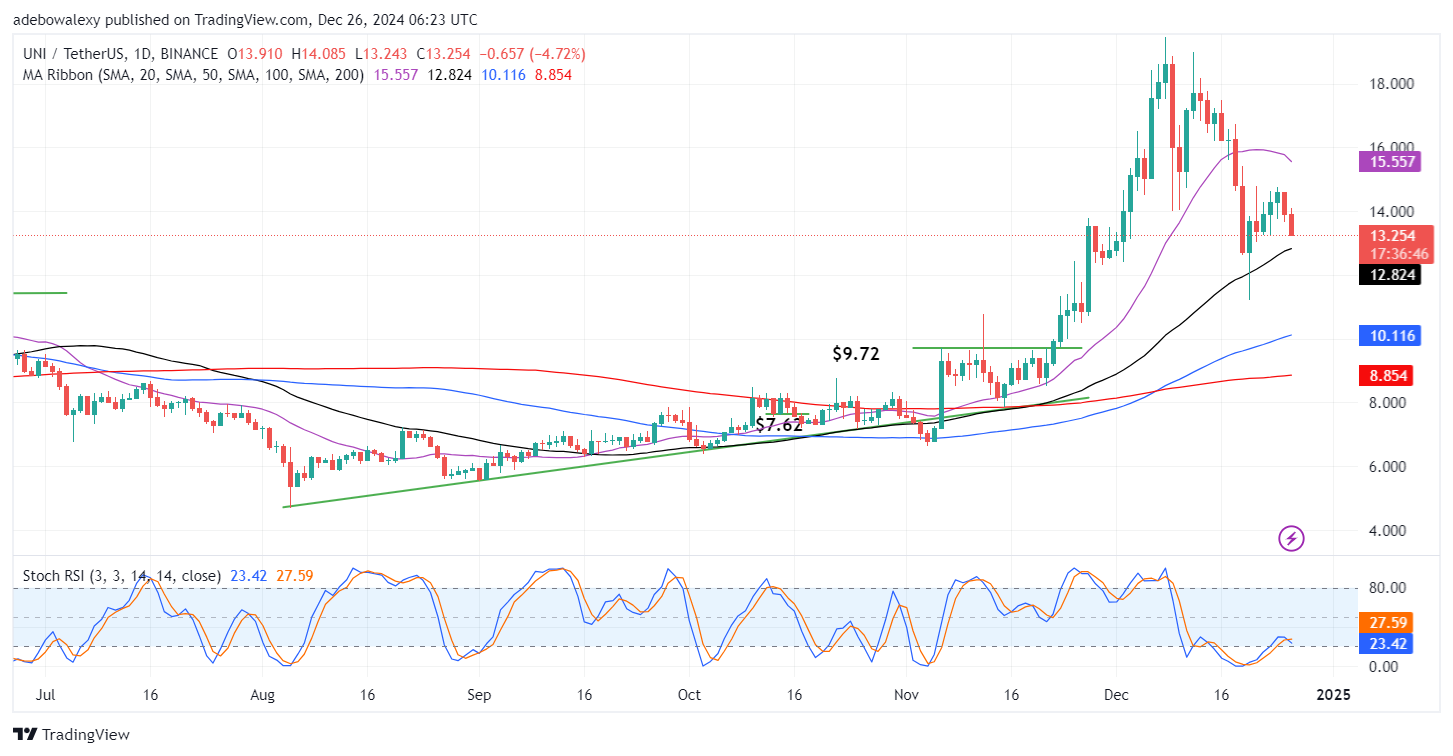
The market retraced more strongly downward in the previous session. The current session has also preserved bearish momentum. Nevertheless, price action remains above the 50-, 100-, and 200-day Moving Average (MA) lines. Meanwhile, the Stochastic Relative Strength Index (RSI) lines are below the 50 threshold of the indicator. Also, the lines of this indicator have delivered a crossover, with the subsequent lines moving sideways.
Uniswap Price Prediction: UNI/USDT Prepares to Descend Lower
Price action in the Uniswap market appears prepared to continue downward. Price action has continued downward in the current session. Furthermore, downward forces have maintained their bearish momentum. Consequently, it appears that price action is likely to make another low.
However, the position of price action above the 50-day MA curve suggests that this technical landmark is an immediate support level. Nevertheless, considering the momentum, it seems price action may tend toward a more significant technical support level at the $12.00 price mark.
Uniswap Price Prediction: UNI/USDT Bearish Momentum Looks Refreshed (4-Hour Chart)
Even on the Uniswap 4-hour chart, price action can be seen diving further downward. The market consolidated in the past two sessions. Also, the 20- and 50-day MA lines are converging above the recent price action. Technically, price action lies below all the MA lines. The Stochastic RSI lines are also still falling into the oversold region.
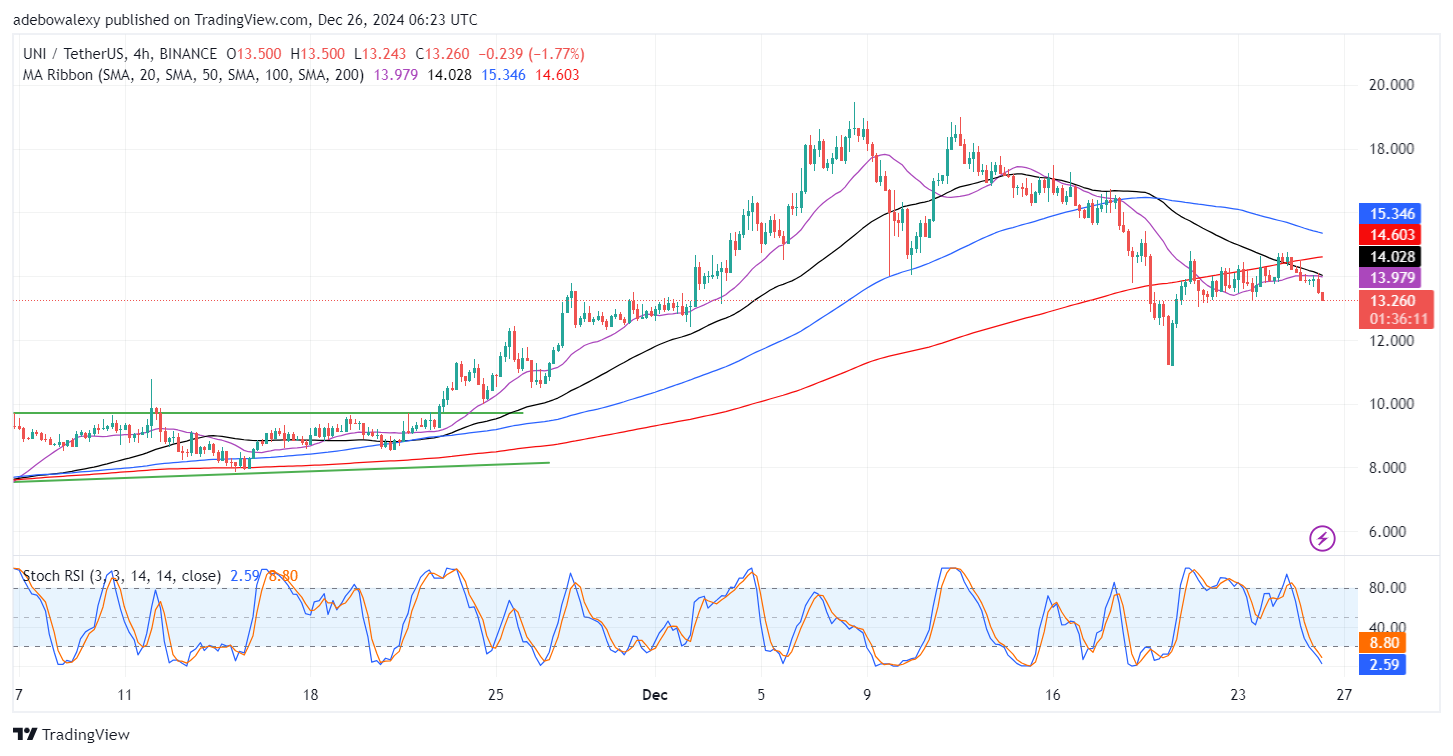
Technically, it appears that price action is likely to fall lower considering all the available indications from this market. The fact that price action has appeared below all the MAs and below a crossing of the MA lines suggests that headwinds are in a position to push the market lower towards the $12.00 price level.