Polkadot Slides As It Returns To Its Previous Low of $4.13
Estimated Reading Time: 2 minutes
Don’t invest unless you’re prepared to lose all the money you invest. This is a high-risk investment and you are unlikely to be protected if something goes wrong. Take 2 minutes to learn more

Polkadot (DOT) Long-Term Analysis: Bearish
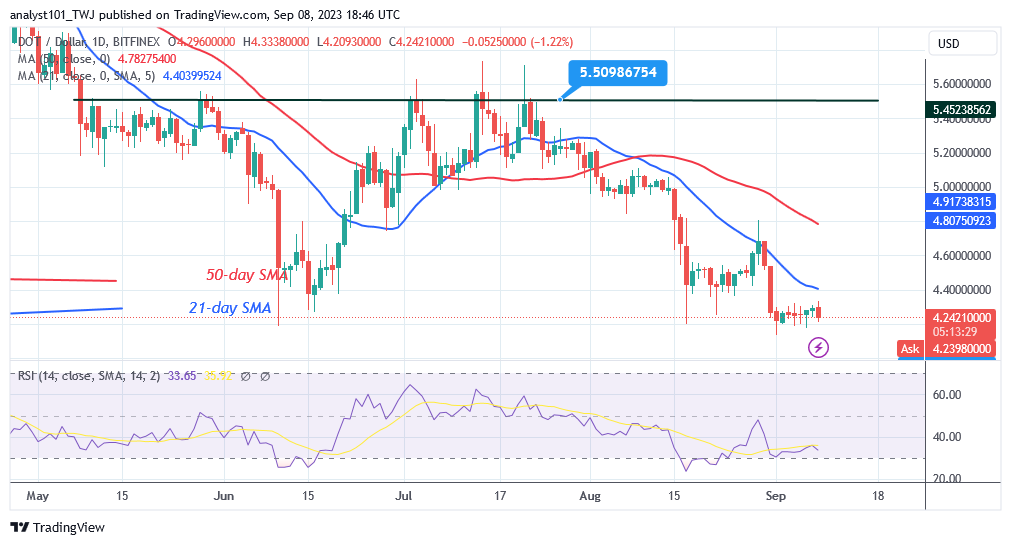
Polkadot’s (DOT) price dropped to the bottom of the chart on September 1 as it returned to a previous low of $4.13. DOT price fell to a low of $4.13 before pulling back to resume consolidation. This new drop has further narrowed the pricing range to $4.13 and $4.40. The present price level of $4.13 corresponds to the historical price levels of June 10, 2023, and December 28, 2022.
Today, DOT/USD is sliding and has returned to its prior low of $4.13. If the current support holds, DOT/USD will move between $4.13 and $4.40. On the downside, if the bears break through the existing support, the market will fall to a low of $4.00.
Technical indicators:
Major Resistance Levels – $10, $12, $14
Major Support Levels – $6, $4, $2
Polkadot (DOT) Indicator Analysis
The recent decrease has pushed the cryptocurrency to the Relative Strength Index level of 30 for period 14. The price signal indicates that the coin is in the market’s oversold zone. The crypto’s price drops when the moving average lines repel the price bars. A probable fall is indicated by price bars that are below the moving average lines.
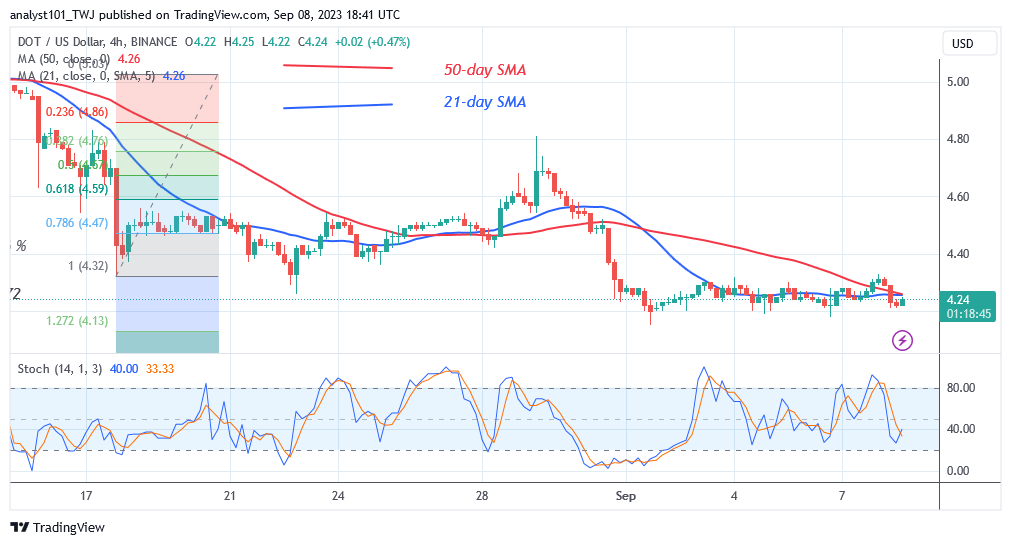
The altcoin is in a negative trend below the daily Stochastic threshold of 40.
What Is the Next Direction for Polkadot (DOT)?
Polkadot has reached bearish exhaustion as it returns to its previous low of $4.13. The pricing range is now between levels $4.13 and $4.40. When these levels are breached, the altcoin will trend.
You can purchase Lucky Block here. Buy LBLOCK
Note: Cryptosignals.org is not a financial advisor. Do your research before investing your funds in any financial asset or presented product or event. We are not responsible for your investing results