Tamadoge (TAMA/USD): Will $0.0015 Be Its Launchpad?
Estimated Reading Time: 3 minutes
Don’t invest unless you’re prepared to lose all the money you invest. This is a high-risk investment and you are unlikely to be protected if something goes wrong. Take 2 minutes to learn more
The TAMA/USD market has experienced sustained bearish pressure, leading to a steady decline from previous highs. A critical support level at $0.0017, which had previously held firm, has now been breached. Although there was a brief attempt to stabilize at $0.0016, the price has further declined to $0.0015, where it currently stands. However, we are now observing a gradual shift in price action towards recovery, suggesting that the $0.0015 level may be acting as a launchpad for a potential rebound.
Key Levels
- Resistance: $0.013, $0.014, and $0.015
- Support: $0.0015, $0.00145 and $0.0014
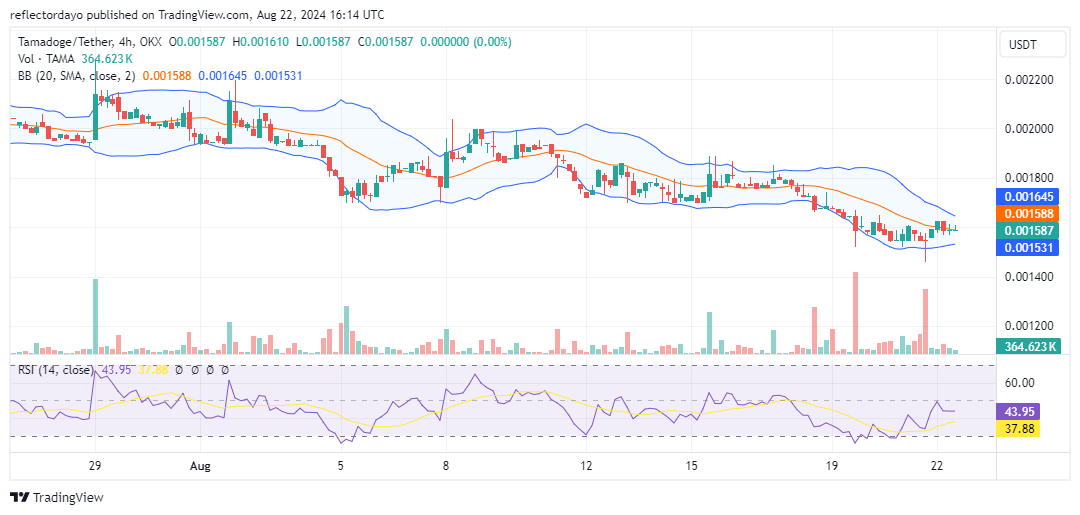
TAMA/USD Price Analysis: The Indicators’ Point of View
Technical indicators are currently signaling a potential recovery in price action. The lower standard deviation curve of the Bollinger Bands is converging upward, suggesting that the bulls may have found a solid support level, which they are attempting to use to push the market in an upward direction. However, as the market begins to rally, price movements are flattening around the 20-day moving average which is at the $0.00159 (near the $0.0016 price level). Similarly, the Relative Strength Index (RSI) has recovered from the oversold threshold and is now ranging sideways at the 43 level. The price is stabilizing around $0.00158, indicating an equilibrium. This RSI level suggests that consolidation is occurring below the 50 mark, which is the midpoint of the RSI.
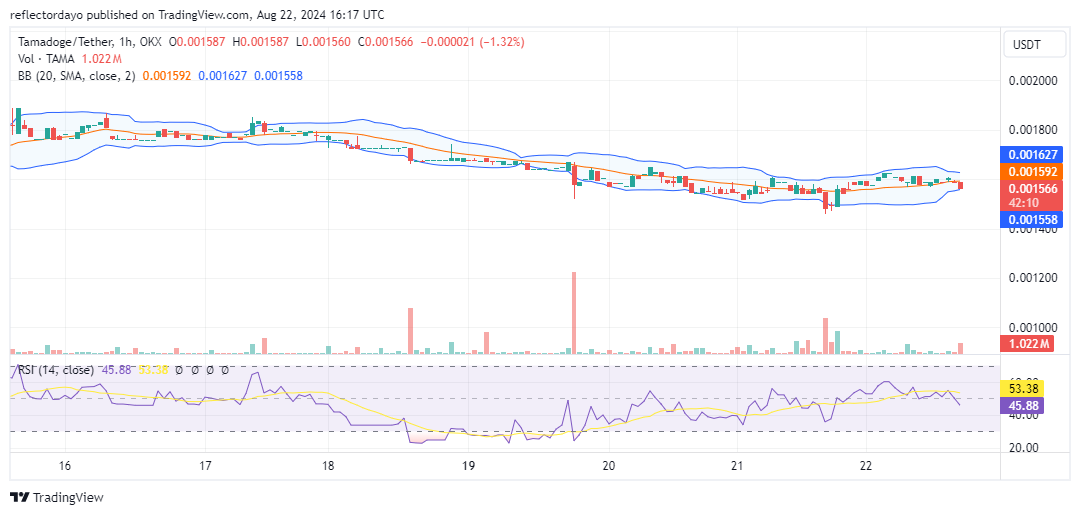
Tamadoge Short-Term Outlook: 1-Hour Chart
The 1-hour chart supports the emerging consolidation trend, with the Bollinger Bands showing a slight upward shift and slowing as the price action stabilizes near the $0.0016 threshold. The $0.0015 level continues to provide strong support as the market reaches a critical juncture in its potential upside movement. Traders should watch for a breakout above $0.0016, as it would signal that the market is primed for further upward momentum. Alternatively, the crypto signal may consolidate at this level for a while before gaining upward traction.
Don’t miss your last chance! Make your final push to the top.
This is your final chance to climb this week’s leaderboard! 🚨
The very best #Tamadoge players will get the highest return of $TAMA 🎉
Download, play and earn on any of our games here 👇
📱 Android: https://t.co/10UNfVWWwB…
📱 iOS: https://t.co/yAl2FhwZTu… pic.twitter.com/IGi2KmtQiL— TAMADOGE (@Tamadogecoin) August 21, 2024