Tamadoge (TAMA/USD) Seeks a Launchpad At $0.0015
Estimated Reading Time: 2 minutes
Don’t invest unless you’re prepared to lose all the money you invest. This is a high-risk investment and you are unlikely to be protected if something goes wrong. Take 2 minutes to learn more
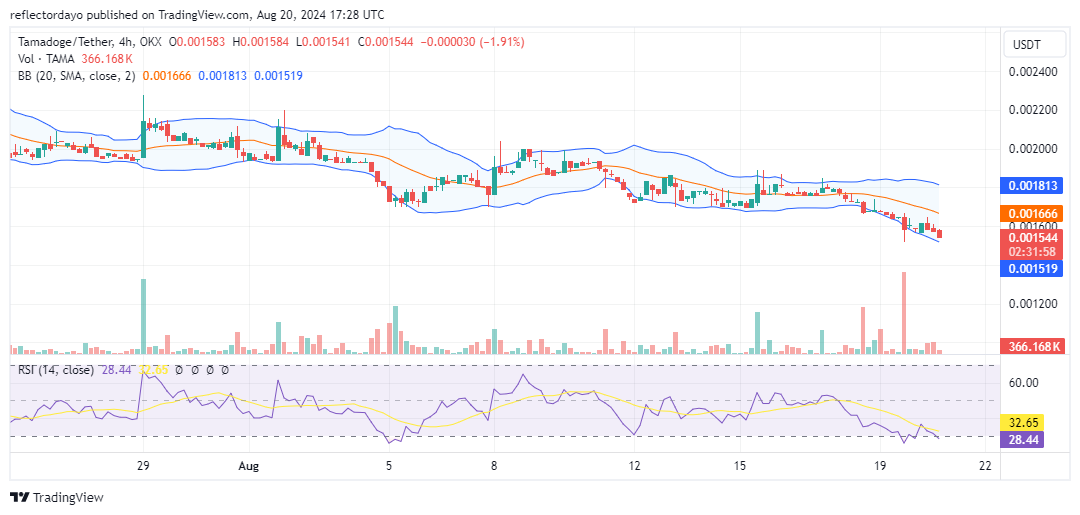
The Tamadoge chart clearly shows a downtrend, with the key $0.0017 price level—previously a stronghold for the bulls after being dislodged from $0.0020 by bearish pressure—finally giving way to further downward movement. Initially, the bulls regrouped at the $0.0016 level, but they have since tested the $0.0015 price threshold, where the current trading session is now situated. There is hope that a bullish recovery surge may occur at this level soon.
Key Levels
- Resistance: $0.013, $0.014, and $0.015
- Support: $0.0018, $0.00175 and $0.0016
TAMA/USD Price Analysis: The Indicators’ Point of View
The indicators are currently signaling a strong sell. The Bollinger Bands, which were previously moving sideways, now show the lower band diverging downward, indicating increasing bearish pressure. Additionally, the Relative Strength Index (RSI) is hovering near the 30 level, the threshold of the oversold region, further highlighting the ongoing bearish momentum in the market. Ideally, as the trading volume decreases, volatility should also decline. This could lead to a Tamadoge price correction that may initiate a rally, potentially bringing the price back to the $0.002 area.
Tamadoge Short-Term Outlook: 1-Hour Chart
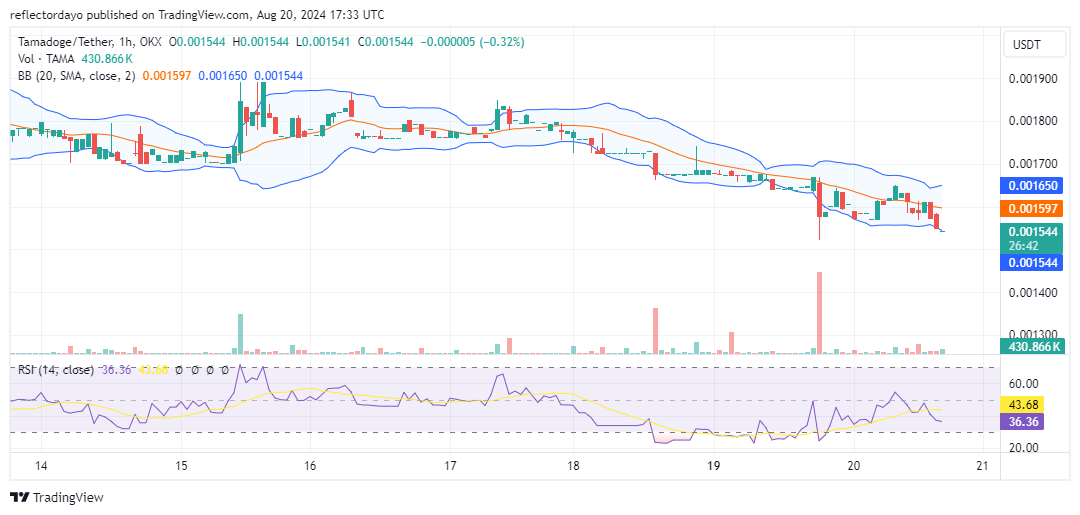
While the Bollinger Bands on the 4-hour chart show a divergence in the lower band, the 1-hour timeframe reveals a fully developed downtrend. Despite this crypto signal, the $0.0015 price level still holds potential as a new support level and could serve as a launchpad for a recovery toward the $0.002 price area. Traders should closely monitor this level and be prepared to enter a buying position.
Buy TAMA/USD!
Test your speed with the sharpest mobile runner – #TamadogePursuit! 🏃♀️ 💨
1️⃣ Get started – Sign up with 20 free credits for a boost 🔋
2️⃣ Rise up – Play games and climb the leaderboards 🆙
3️⃣ Earn $TAMA – Win prizes with weekly giveaways for top players! 🥇 pic.twitter.com/uavYZww4rI
— TAMADOGE (@Tamadogecoin) August 12, 2024