Tamadoge (TAMA/USD) Consolidates Before Next Bull Run
Estimated Reading Time: 2 minutes
Don’t invest unless you’re prepared to lose all the money you invest. This is a high-risk investment and you are unlikely to be protected if something goes wrong. Take 2 minutes to learn more

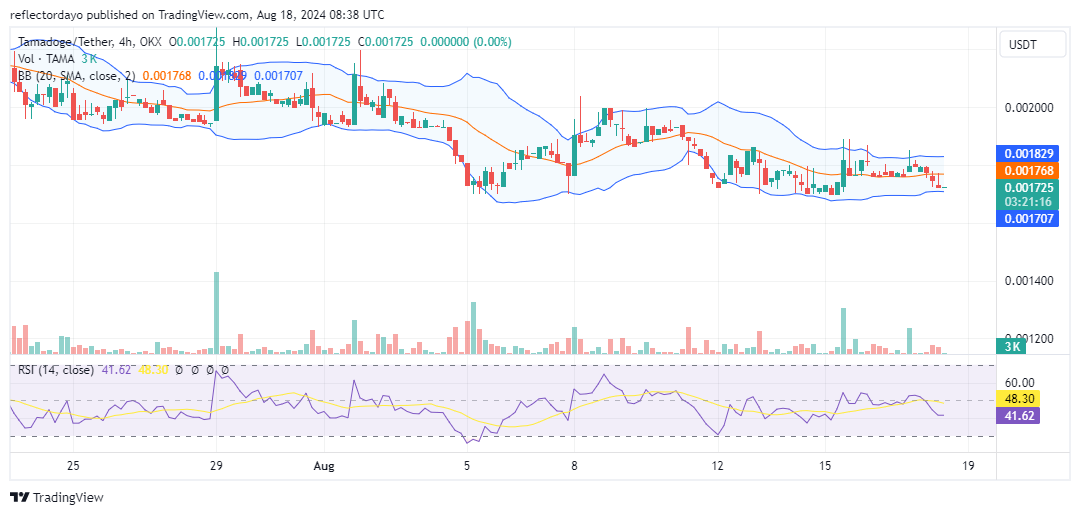
The $0.002 level previously served as a critical support zone, where demand and supply struggled for control until the price eventually broke downward, finding support at $0.0017. Currently, the TAMA/USD market is consolidating, with demand and supply evenly matched. This TAMA/USD consolidation has been ongoing for some time, raising the key question of whether the bulls can break through the resistance. To assess this possibility, let’s examine the relevant indicators.
Key Levels
- Resistance: $0.013, $0.014, and $0.015
- Support: $0.0018, $0.00175 and $0.0016
TAMA/USD Price Analysis: The Indicators’ Point of View
From the perspective of the indicators, while price action has reached an equilibrium, it remains slightly below the key $0.00002 level, a critical point of interest for both bulls and bears. The horizontally moving Bollinger Bands suggest that the bearish momentum is not strong enough to break below the $0.00172 level, which has become a key support for the bulls after they were pushed down from the $0.002 level. Although the previous 4-hour trading session displayed a strong bearish crypto signal—a shooting star—the current price action is marked by a flat doji, indicating a complete stalemate. The trading volume, represented by an almost nonexistent histogram, suggests that the bearish market is unlikely to push the price below the $0.00172 level.
Tamadoge Short-Term Outlook: 1-Hour Chart
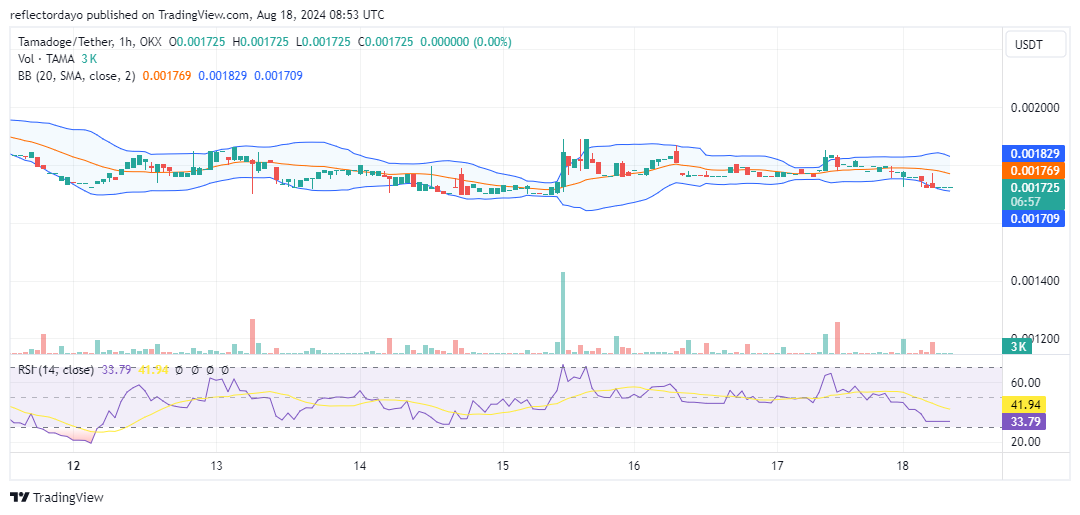
The Bollinger Bands on the 1-hour chart reveal a widening lower band compared to the upper band, indicating a recent slight increase in bearish momentum. However, after the price was rejected at the $0.00172 level, the market has shifted upward as the bulls renew their efforts to break above the $0.002 level. With the market holding steady at $0.00172, now serving as the new support below $0.002, the next likely move for the Tamadoge market appears to be in the upward direction.
Buy Tamadoge!
What goes down, must come up 🔥 pic.twitter.com/NUgCh6htu9
— $SPONGE (@spongeoneth) August 17, 2024