ZKsync (ZK/USDT) Shows Early Reversal Signal Amid Tight Bollinger Band Squeeze
Estimated Reading Time: 3 minutes
Don’t invest unless you’re prepared to lose all the money you invest. This is a high-risk investment and you are unlikely to be protected if something goes wrong. Take 2 minutes to learn more

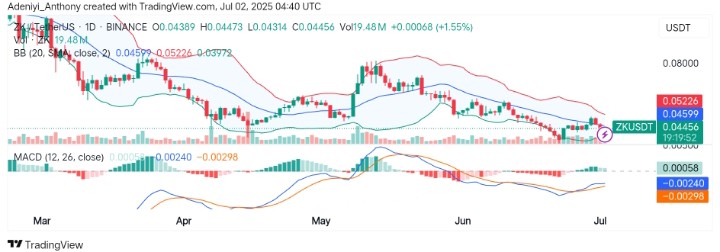
The ZKsync against the Tether on the daily timeframe displays a market that has been in a gradual downtrend since late May but is now beginning to stabilize near the lower Bollinger Band.
However, after a period of low volatility and consistent price compression, the recent bullish candle and minor increase in volume suggest early signs of a potential trend reversal or short-term breakout as the Bollinger Bands are starting to tighten.
Currently, ZKsync trades at $0.04456 with over 19 million traded volumes for the day.
ZK Technical Indicators
Major Resistance Levels: $0.04599, $0.05226, and $0.05800
Major Support Levels: $0.04314, $0.03972, and $0.03500
ZK/USDT Technical Analysis
The analysis of ZKsync against the Tether shows that the market’s short-term sentiment is turning neutral-bullish. However, the price appears to be bouncing off the lower band and moving toward the middle band, suggesting rising momentum and a bullish crossover as the MACD displays green histogram bars.
To this end, an entry at the current level seems plausible. However, a move above $0.04460 appears as a better entry point with $0.0520 as the target.
ZK/USDT Analysis: A Bullish Setup After Correction
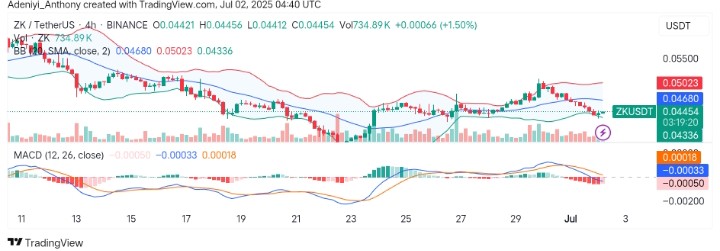
The 4-hour chart of ZK/USDT shows a short-term pullback following a brief rally that occurred toward the end of June. However, after the upward move, the price corrected back toward the lower Bollinger Band, suggesting temporary weakness, but the recent candlestick shows buyers are stepping back in.
On the other hand, the MACD is slightly below the zero line but showing reduced bearish momentum, which may signal that the selling pressure is fading.
To this end, the market sentiment appears cautiously bullish as the pair consolidates within a tight range. A close above $0.04450 with increasing volumes would mark the beginning of a northbound journey to $0.05000; otherwise, the air may continue to consolidate at the current level.
You can purchase crypto coins here. Buy LBlock