ZKsync (ZK/USDT) Eyes Potential Reversal Amid Stochastic RSI Signals, Will the Bulls Break the EMAs?
Estimated Reading Time: 3 minutes
Don’t invest unless you’re prepared to lose all the money you invest. This is a high-risk investment and you are unlikely to be protected if something goes wrong. Take 2 minutes to learn more

The market for ZKsync against the Tether has faced continuous selling pressure since the first quarter of the year, remaining bearish as the pair’s price have consistently traded below key GMMA (Guppy Multiple Moving Averages) ribbons. This reflects sellers maintaining control over the trend.
However, the recent rice action from at the consolidation region, coupled with a strongly overbought Stochastic RSI suggests that buyers may test the strength of the downtrend in the near term.
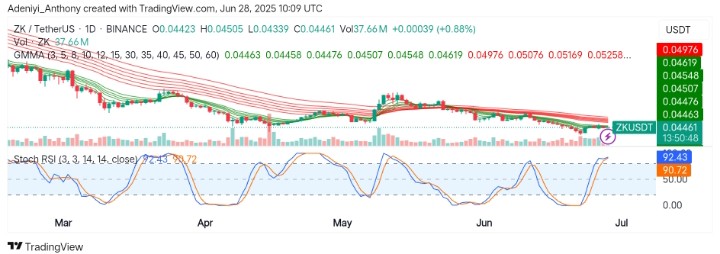
To this end, ZKsync trades at $0.04461 with 37.66 million traded volumes for the day.
Technical Indicators
Major Resistance Levels: $0.04550, $0.04620, and $0.04980
Major Support Levels: $0.04380, $0.04200, and $0.04000
ZK/USDT Technical Analysis
The analysis of ZKsync against the Tether on the daily timeframe has been dominated by a long-term downtrend, with the price consistently below the GMMA.
However, the Stochastic RSI is sharply overbought at 92.43, suggesting the upside may be overstretched, which could lead to a short-term pullback before any reversal as the volume shows no confirmed strong bullish conviction.
On the other hand, a possible descending pattern is developing despite overbought condition.
This may later trigger a bullish breakout above $0.04550 resistance if bullish participation increase.
To this end, a breakout above $0.04550 to confirm a wedge reversal. If rejected there, expect a continuation of the bearish trend targeting 0.04380 and below.
ZK/USDT Analysis: A Continued Downtrend or Potential Upside Bounce?
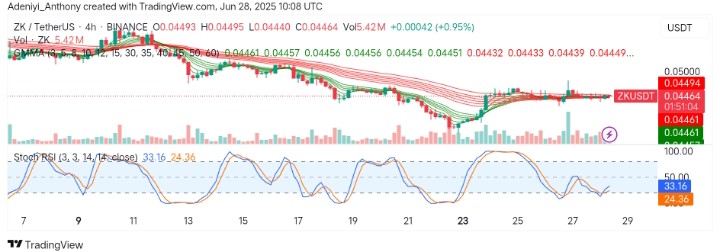
On the 4H chart, ZK/USDT is still operating below the clustered GMMA, confirming short-term bearish continuation. However, the price is compressing near $0.04461 with low volatility, suggesting a breakout is approaching.
From another angle, the Stochastic RSI on the 4H appears at 33.16, hinting that a bounce attempt could develop if momentum improves. To this end, a 4H close above $0.04500 with strong volume would strengthen any bullish breakout scenario on the daily chart.
Until then, the 4H bias remains neutral to bearish, with the price coiling for its next larger move.
You can purchase crypto coins here. Buy LBlock