Zksync (ZK/USDT) Building Base for a Potential Breakout
Estimated Reading Time: 3 minutes
Don’t invest unless you’re prepared to lose all the money you invest. This is a high-risk investment and you are unlikely to be protected if something goes wrong. Take 2 minutes to learn more

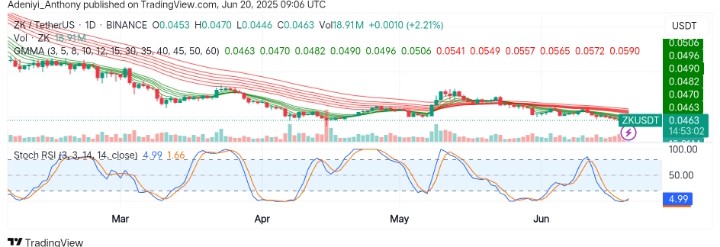
The market for Zkysnc against the Tether has remained cautiously bearish for a while, steadily dwindling towards the south as bearish traders gain from short positions. The pair’s price appears to be consolidating below the Guppy Multiple Moving Averages (GMMA), suggesting bearish control.
However, activities predicted by the Stochastic RSI show the pair is poised for a long-term bullish bounce, and as the Zksync appears to be compressing, a breakout to the north might be around the corner.
Currently, Zksync trades at $0.0463, printing over 18 million traded volumes at the moment.
Technical Indicators
Major Resistance Levels: $0.0470, $0.0500, and $0.0550
Major Support Levels: $0.0450, $0.0430, and $0.0400
Zkysnc Technical Analysis
On the daily timeframe, Zksync against the Tether broadly appears to be in a downtrend, as shown by the direction of the GMMA. However, recent bullish candlestick formation suggests potential accumulation and breakout as the actions await volume confirmation.
From another angle, the Stochastic RSI operates in the oversold zone, indicating current dominance. However, the curvature of the lines from the oversold region suggests a reversal may be spotted in the near term.
To this end, as selling volume decreases, a close above $0.0470 with improving volumes would orchestrate a move towards further upside. Conversely, a break below $0.0400 would invalidate this move.
ZK/USDT Analysis: Expectations
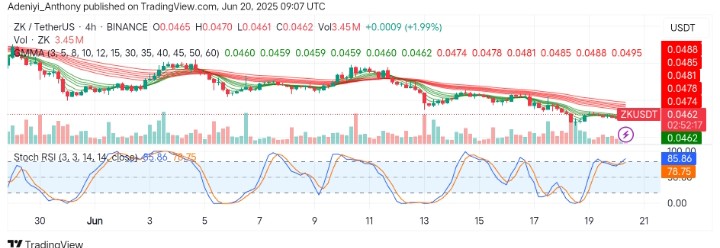
On the 4H chart, ZK/USDT shows a short-term bullish bounce off the $0.0461 local zone after multiple rejections. However, the trading volume appears not strong for a valid breakout, as the Stochastic RSI hit the overbought region.
Despite this, the rising slope of the momentum oscillator supports near-term bullish control as the pair in the short term appears to break above $0.0470 to confirm an upside move. However, this indicates a mild bullish setup under a bearish structure needing more strong bullish participation.
You can purchase crypto coins here. Buy LBlock