Zksync (ZK/USDT) Shows Signs of Bullish Attempt Amid Dropping Momentum
Estimated Reading Time: 3 minutes
Don’t invest unless you’re prepared to lose all the money you invest. This is a high-risk investment and you are unlikely to be protected if something goes wrong. Take 2 minutes to learn more

The trading activities of Zksync against Tether appear to be cautiously bearish, with early signs of change in direction. However, the pair has been in a prolonged downtrend since the second month of the year, recording a series of lower lows. This can be seen in the smooth downtrend of the Guppy Multiple Moving Averages (GMMAs).
The recent price action suggests a possible shift in momentum after the current consolidation phase, as the sets of EMAs converge.
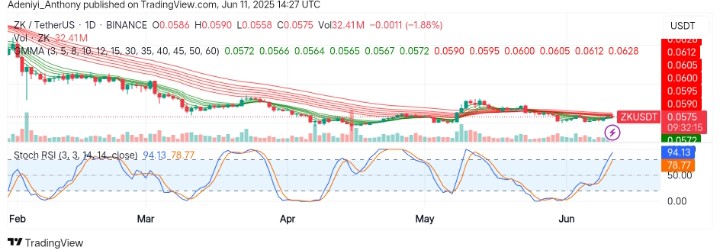
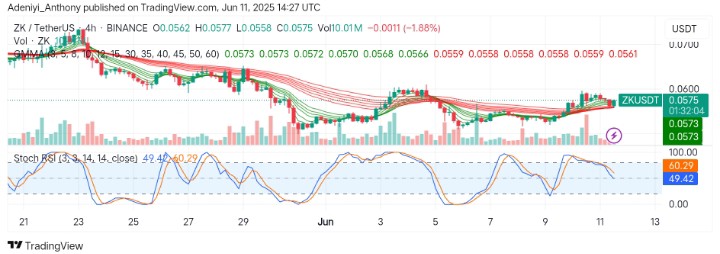
To this end, the momentum indicator suggests a possible pullback as the pair appears overbought, but in the meantime, Zkysnc trades at $0.0575 with over 32.41 million trade volumes.
Technical Indicators
Major Resistance Levels: $0.0605, $0.0670, and $0.0700
Major Support Levels: $0.0573, $0.0560, and $0.0500
Zksync Technical Analysis
The market for Zksync against the Tether on the daily timeframe shows the pair was consolidating in the earlier months and is now ready for a sudden movement. This can also be seen in the recent squeeze of the sets of EMAs as the short-period EMAs advance towards the long-period EMAs. This suggests the pair might experience an upside momentum in the short term if bullish traders take the opportunity.
On the other hand, the Stochastic RSI indicates a strong bullish strength as the lines operate deep into the overbought region.
To this end, a close above $0.0605 with a spike in bullish participants may push the pair’s value toward $0.1000; otherwise, the previous trend may continue.
ZK/USDT Analysis: Where from Here?
From the shorter timeframe (4H chart), ZK/USDT appears to be operating around the $0.073 level above the GMMAs, which displays a bullish crossover. However, recent price action on this timeframe suggests a pullback as the Stochastic RSI faces south from the overbought region.
To this end, a fall below $0.0570 would pull the price below $0.0500, but a rise towards $0.0605 would lead to improvement to be recorded.
You can purchase crypto coins here. Buy LBlock