Zksync (ZK/USDT) Poised for Recovery: Is a Trend Reversal on the Horizon?
Estimated Reading Time: 3 minutes
Don’t invest unless you’re prepared to lose all the money you invest. This is a high-risk investment and you are unlikely to be protected if something goes wrong. Take 2 minutes to learn more

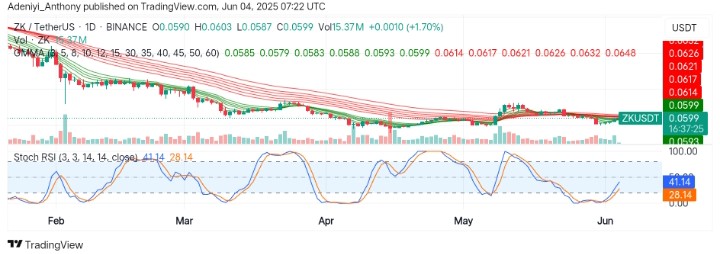
Over time, the market for Zksync against the Tether has been bearishly dominated, moving to the south since the first quarter of the year. However, the tide’s direction is changing as the pair flashes a subtle signal of a potential base around $0.0593.
Recently, the pair has shown a bullish inking, sparking renewed hope among traders and other stakeholders. Both indicators on the daily chart suggest a northbound journey ahead.
Currently, Zksync trades at $0.0599, posting a 1.70% gain and over 15.3 million traded volumes for the day.
Technical Indicators
Major Resistance Levels: $0.0614, $0.0648, and $0.0750
Major Support Levels: $0.0575, $0.0550, and $0.0490
Zksync Technical Indicators
The analysis of Zksync against the Tether on the daily chart shows the pair has been predominantly bearish in the first and early quarters of the year. However, the price activities around the Guppy Multiple Moving Averages (GMMAs) show buyers are determined to push the price above the current resistance as the sets of EMAs prepare for a bullish crossover.
On the other hand, the Stochastic RSI appears to be climbing out of the oversold region as the lines advance into the 50-mark level. However, this suggests bullish momentum is growing, and in the short term, the price may hit above the $0.0648 level.
To this end, if the momentum increases and the price breaks above $0.0614, a short-term trend reversal may be witnessed; otherwise, the pair may continue its previous move.
ZK/USDT Analysis: What to Expect
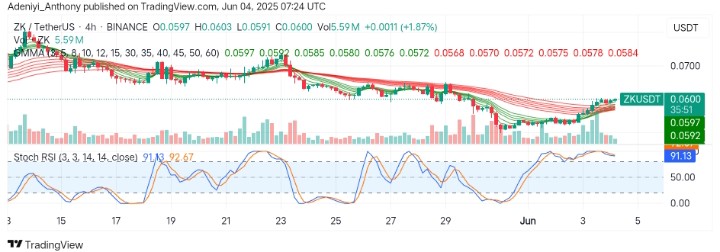
On the 4h chart, ZK/USDT appears to be reinforcing the daily bullish structure, as the short-period EMAs remain above the long-period EMAs with increased volumes of around 1.87%. However, the momentum oscillator beneath the chart suggests caution against a late move, as the lines operate bending down from the overbought region.
To this end, the current GMMAs compression and upside expansion show a clear shift. However, a pullback below $0.0575 would suggest a breakdown to test previous supports.
You can purchase crypto coins here. Buy LBlock