Zksync (ZK/USDT) Shows Signs of Recovery as Bulls Defend Key Area
Estimated Reading Time: 3 minutes
Don’t invest unless you’re prepared to lose all the money you invest. This is a high-risk investment and you are unlikely to be protected if something goes wrong. Take 2 minutes to learn more

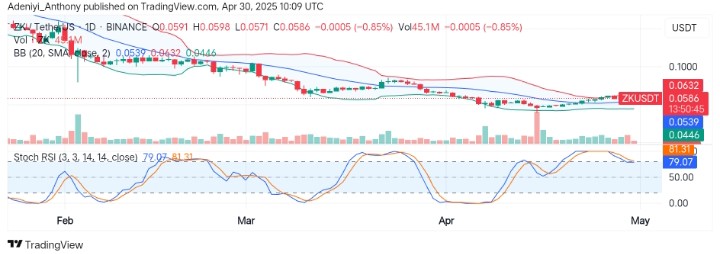
The market for Zksync against the Tether has recently emerged from an extended downtrend, displaying signs of price compression and a potential reversal. However, after weeks of declining momentum, recent price actions suggest an accumulation just below the upper segment of the Bollinger Bands, hinting the pair may be preparing for a short-term bullish setup.
Recently, the pair has seen a slight increase in the traded volume. However, the overbought signal from the Stochastic RSI suggests caution is needed as the indicator suggests a possible cool-down.
To this end, the price pushes towards the dynamic line at $0.0539, awaiting a decisive breakout in either direction.
Currently, ZKsync trades at $0.0536, with 45.1 million traded volumes for the day already.
Technical Indicators
Major Resistance Levels: $0.0632, $0.0700, and $0.0800
Major Support Levels: $0.0539, $0.0446, and $0.0400
ZKsync Technical Analysis
The analysis of the Zksync against the Tether on the daily chart shows the pair has been trapped in a prolonged downside momentum but is now attempting to build a base around the mid-dynamic level. However, the rising volume and the tightening bands suggest a potential breakout setup, provided the bulls can aggressively enter the market.
On the other hand, the Stochastic RSI appears to be hovering in the overbought region, implying a short-term cool-down may be necessary for a bullish breakout to play out.
To this end, staying above the midline of the bands and the 50-mark level of the oscillator would favor an uptrend towards $0.0700; otherwise, a breakdown below these levels would lead to stronger pressure on the immediate support level.
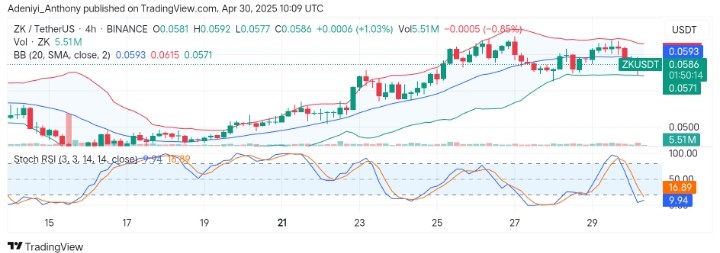
ZK/USDT Analysis: Can the Bulls Sustain the Momentum?
From the 4H timeframe, ZK/USDT confirms the bullish undertone as the pair recently formed a steady upside movement with growing volumes and the formation of higher lows. However, the pair’s price appears to be ranging as the pair’s value is positioned slightly below the mid-band.
Importantly, the Stochastic RSI indicates that more improvement is on the horizon as the lines prepare for a bullish crossover from the oversold region, suggesting current sellers’ pressure may be nearing exhaustion.
To this end, holding above the $0.0571 level is crucial for a break above $0.0632; otherwise, a break below immediate support could lead to sellers’ dominance.
You can purchase crypto coins here. Buy LBlock