SPONGE/USD ($SPONGE) Eyes Potential Upside Rebound from the $0.000101 Level
Estimated Reading Time: 2 minutes
Don’t invest unless you’re prepared to lose all the money you invest. This is a high-risk investment and you are unlikely to be protected if something goes wrong. Take 2 minutes to learn more

After a recent push higher, SPONGE/USD ($SPONGE) is showing signs of pausing near the $0.000101 mark, a level that may serve as a springboard for renewed bullish action. Price activity has started to consolidate, signaling a moment of indecision that often precedes a directional shift.
The market’s ability to reclaim and sustain above the $0.000101 region suggests underlying strength, hinting that the bulls may be preparing for another leg upward. This zone remains a focal point due to its historical importance, and current volume patterns reinforce its relevance.
Key Price Markers:
-
Resistance Levels: $0.000115, $0.000120, $0.000130
-
Support Levels: $0.000100, $0.000090, $0.000085
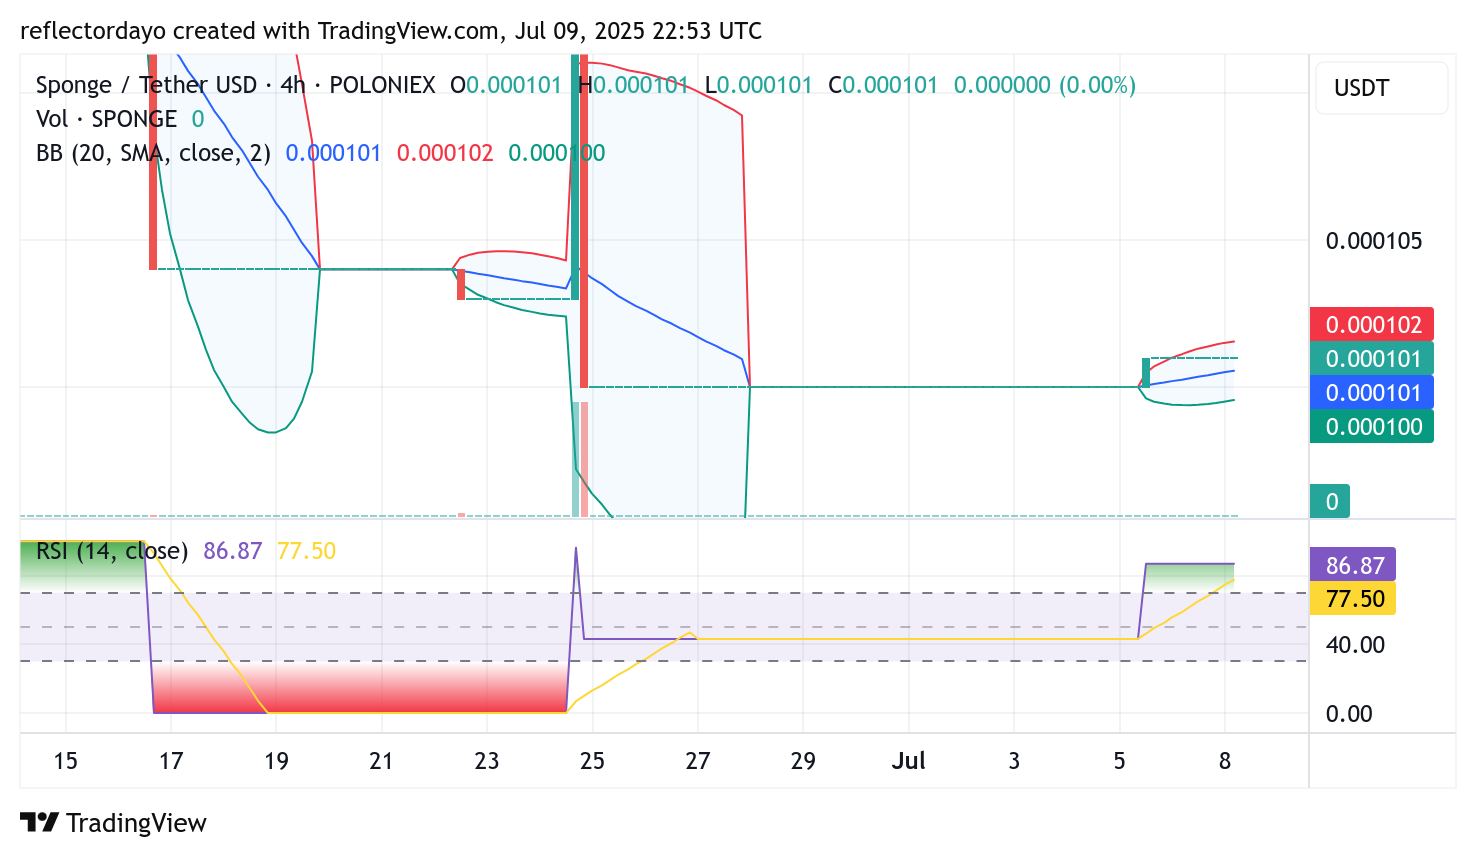
SPONGE/USD 4-Hour Chart: Underlying Bullish Momentum Gains Ground
A closer look at the 4-hour timeframe reveals early signs of a potential breakout in the making. Despite limited price expansion, the uptick in trading volume beneath a stable price range suggests growing interest and accumulation.
$SPONGE has managed to recover from the $0.0001 support and now hovers slightly above it, at $0.000101—an encouraging shift. This subtle climb in the crypto signal, paired with steady volume, may be laying the foundation for a stronger upward move should buying pressure intensify in the near term.
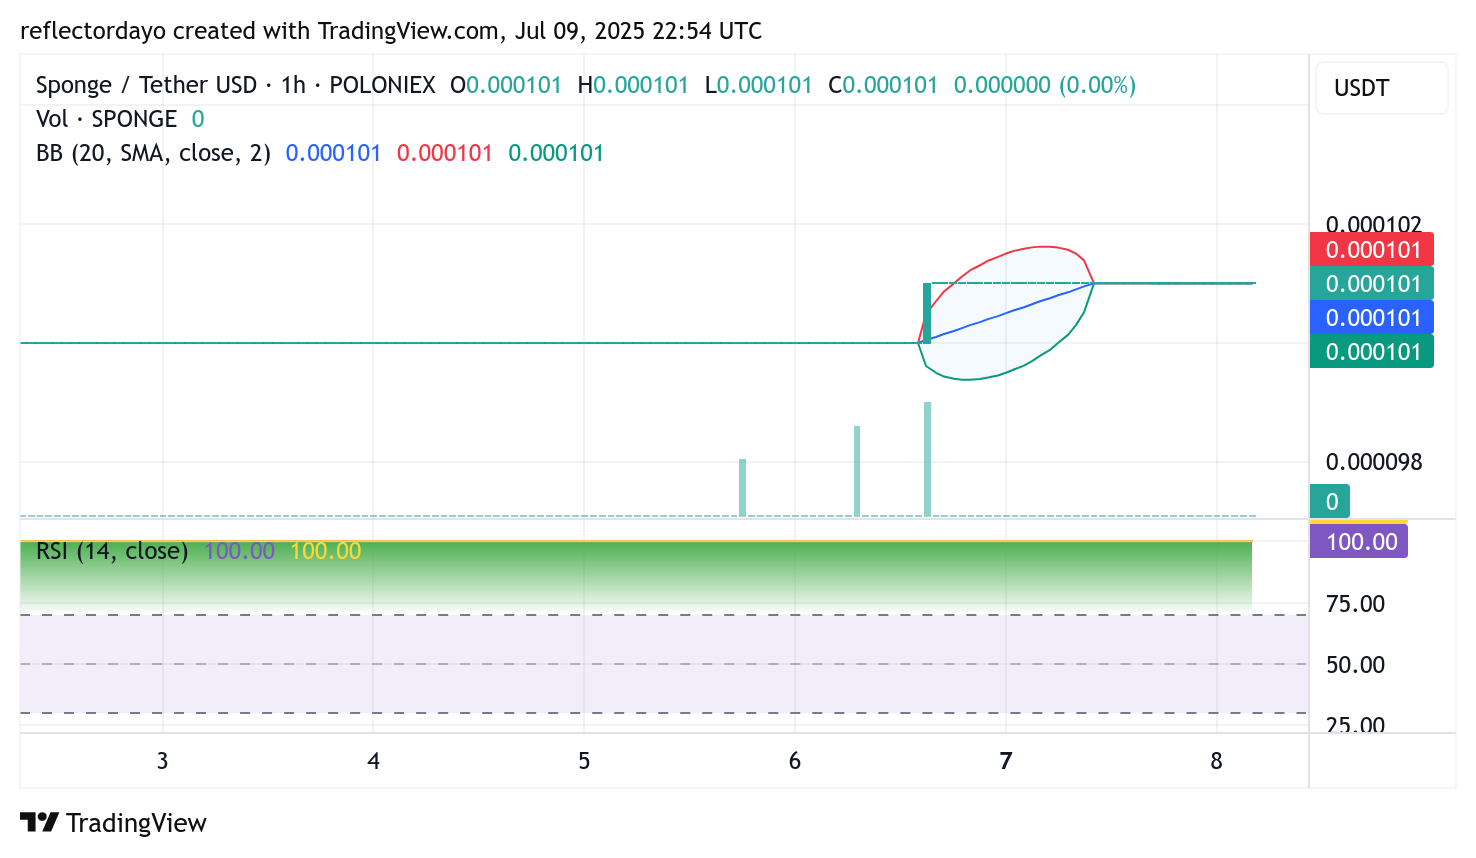
$SPONGE 1-Hour Chart: Consolidation Near Key Pivot Point
The 1-hour chart paints a picture of short-term consolidation, with SPONGE/USD trading tightly around the $0.000101 mark. Volume surges hint at heightened participation, yet the price remains range-bound—a sign that the market is currently weighing its next move.
This price standoff suggests a near-term balance between buyers and sellers. If bullish interest strengthens at this threshold, the next move could be upward. Otherwise, a failure to hold ground may invite a revisit of nearby support zones.
Buy SPONGE/USD!
That one friend who still believes alt season is coming pic.twitter.com/AWBUMnYwPb
— $SPONGE (@spongeoneth) July 8, 2025
Join the SPONGE community and get in on the next big crypto opportunity! Buy Sponge ($SPONGE) today