ZKsync (ZK/USDT) Extends Move to the South
Estimated Reading Time: 3 minutes
Don’t invest unless you’re prepared to lose all the money you invest. This is a high-risk investment and you are unlikely to be protected if something goes wrong. Take 2 minutes to learn more

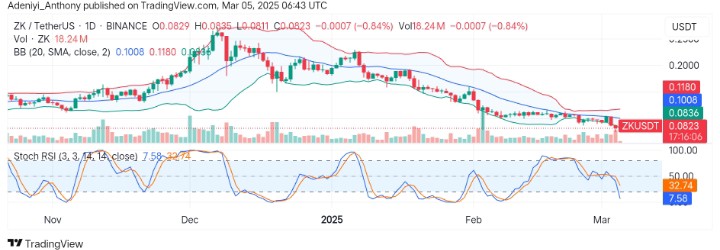
The market for Zksync against the Tether on a daily timeframe has exhibited a bearish trend, moving away from an established height above the $0.2000 level to the current price. Currently, the pair extends its bearish run by 0.84%, showing the severe activities of the sellers as market volume increases.
Recently, the price has been trading under the lower Bollinger band, indicating weak pressure from the bullish traders as the price struggles to hold above previous support levels. However, the Stochastic RSI beneath the chart signals an oversold condition; hopefully, this could be a nice re-entry point for the buyers.
Currently, ZKsync Trades is at $0.0823, with 18.24 million traded volume for the day.
Technical Indicators
Major Resistance Levels: $0.1008, $0.1180, and $0.1250
Major Support Levels: $0.0800, $0.0750, and $0.0700
Zksync Technical Analysis
The analysis for ZKsync against the USDT shows that the overall trend for the pair is bearish, evidenced by the formation of a series of lower lows. However, the price remains under the lower band, indicating a strong oversold condition as sellers push the price further south.
On the other hand, the Stochastic oscillator shows that the price is moving drastically deep into the south. However, the current picture shows a reversal might be around the corner but caution is needed before assuming a trend reversal.
To this end, the pair may be bound for a reversal if the price hits above $0.1008; otherwise, a break below the immediate support level at $0.0800 would send the pair further south.
ZK/USDT Analysis: Where from Here?
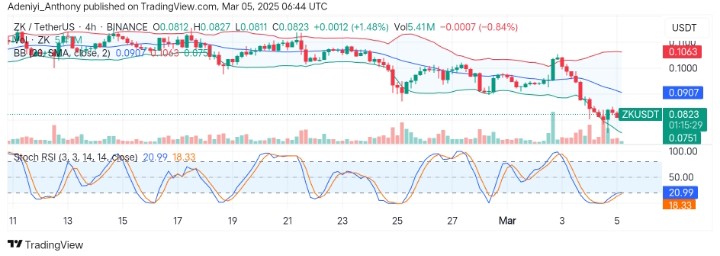
On a 4H chart, ZK/USDT appears to be recovering as the price records a gain of about 1.40% despite the overall market condition. However, the purported bullish move may be short-lived due to the number of bullish participants in the market and price action around the $0.0907 mid-line of the Bollinger.
At the bottom of the chart, the Stochastic oscillator signals that the price is preparing for a breakout, as the blue line stays about the orange line in a sideways movement.
To this end, ZK/USDT may experience a breakout above $0.0907, which could lead to a larger recovery in the near term. Conversely, a move below $0.0800 may lead to a further dip.
You can purchase crypto coins here. Buy LBlock